Portfolio
This portfolio presents a selection of GIS and remote sensing projects centered on spatial data analysis, map design, and visualization. The work includes academic, professional, and independent projects that apply programming and geospatial methods to analyze environmental change, generate maps, and communicate patterns through clear, data-driven visualizations.
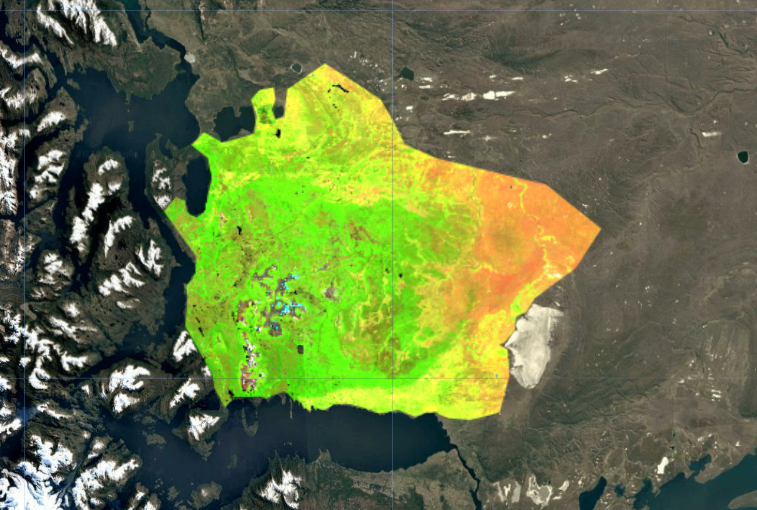
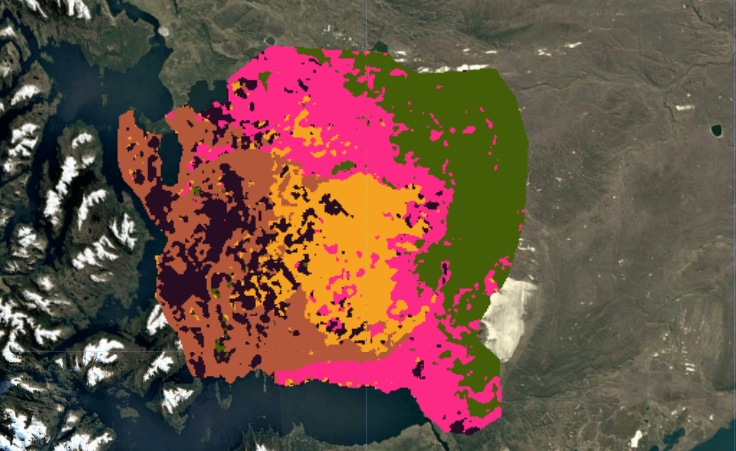
Peatlands in Transition: Remote Sensing Classification
This project applies remote sensing and machine learning techniques in Google Earth Engine (GEE) to classify wetlands and surrounding land cover in Southern Patagonia, Chile. The work represents Phase I of my Master’s research at the University of Michigan School for Environment and Sustainability and establishes a baseline land cover map for a remote, cloud-prone region with limited ground data.
Land Cover Legend
Methodology
- Data: Sentinel-2 Surface Reflectance (Oct 2023 – Feb 2024)
- Pre-processing: Cloud and shadow masking using the Scene Classification Layer (SCL)
- Feature Engineering: NDVI, NDMI, EVI, Tasseled Cap Wetness, and normalized slope
- Models Tested: K-Means clustering, SNIC object-based segmentation, and Random Forest classification
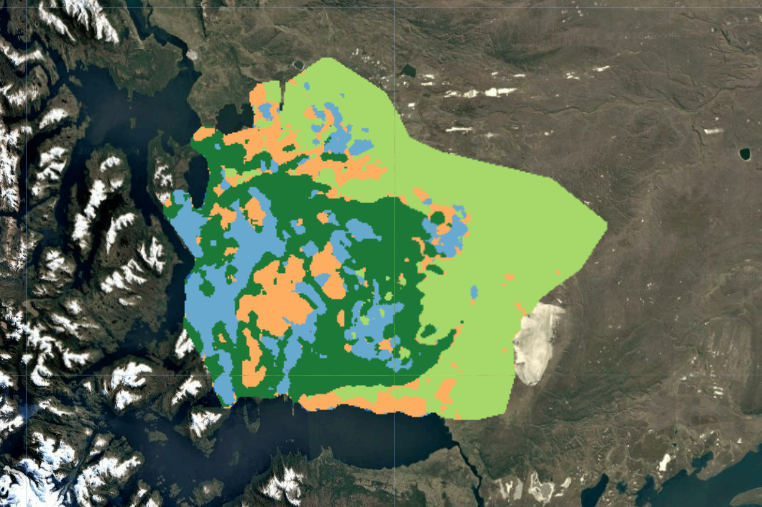
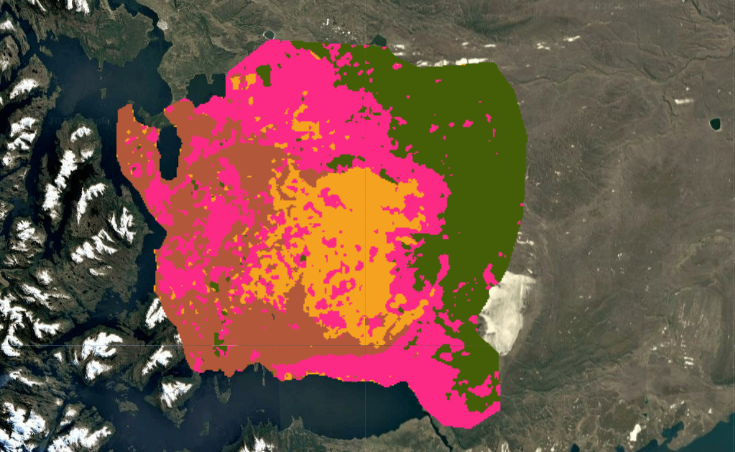
Model Development & Iteration
The final supervised classification (above) was the result of iterative experimentation. Initial pixel-based K-Means clustering revealed broad spectral patterns but produced noisy, fragmented outputs. Object-based segmentation using SNIC improved spatial coherence by grouping spectrally similar pixels into landscape objects, but proved computationally expensive and still could not deliniate forests from wetlands. Ultimately, a supervised Random Forest classifier produced the most ecologically meaningful and spatially consistent results.
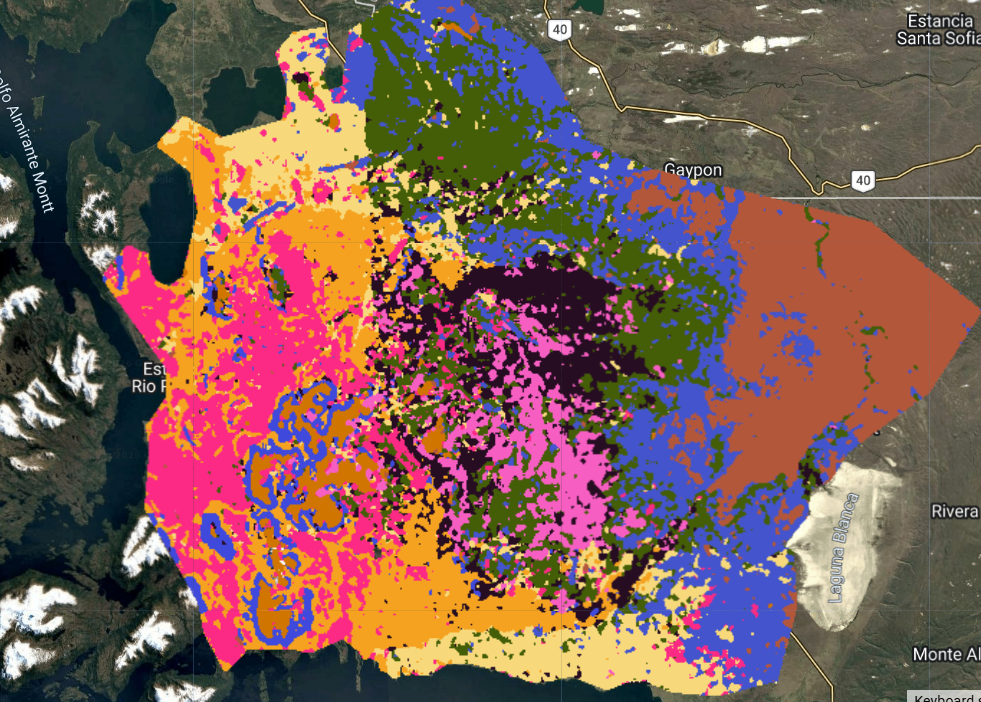
Initial K-Means – 9 (Unsmoothed)
K-Means – 4 Clusters
K-Means – 5 Clusters
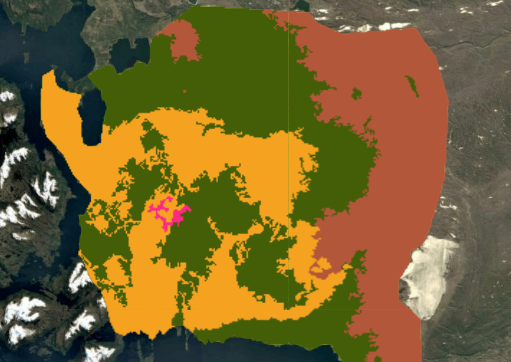
SNIC Object-Based – 4 Clusters
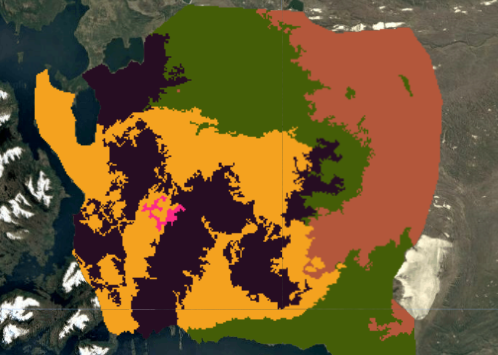
SNIC Object-Based – 5 Clusters
Source Code: View project on GitHub
Automated Map Series using ArcPy Scripting
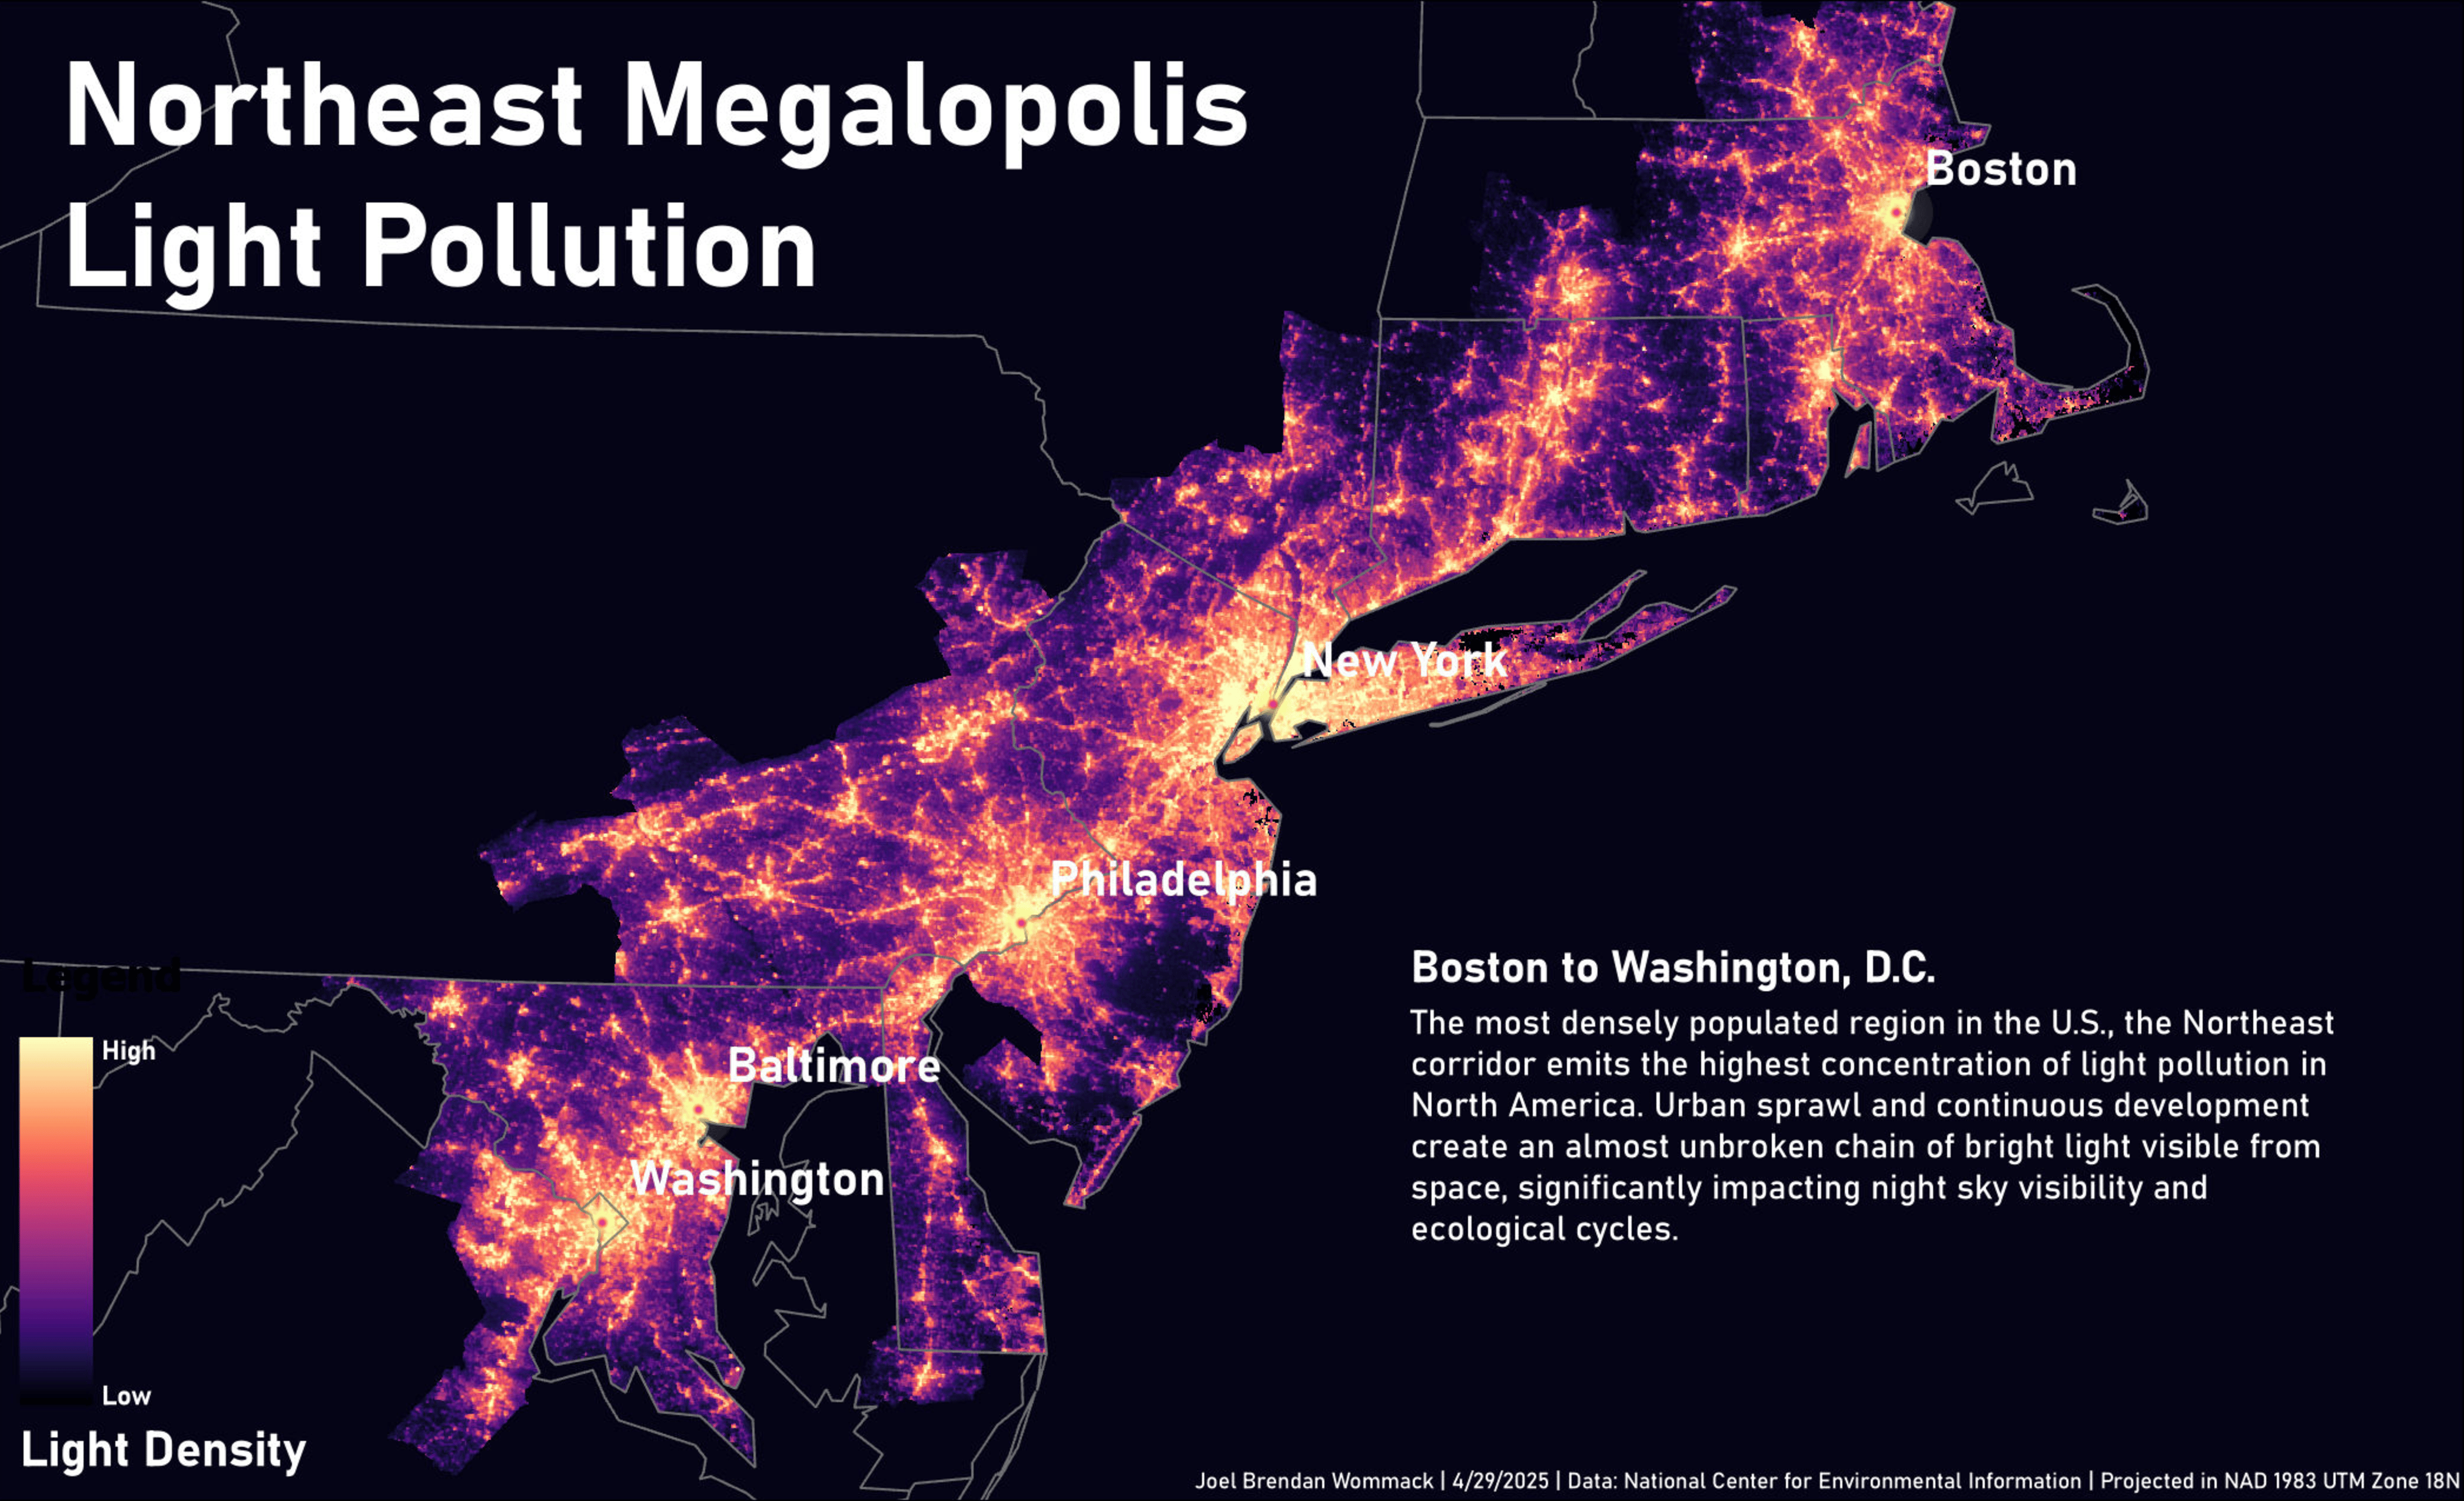
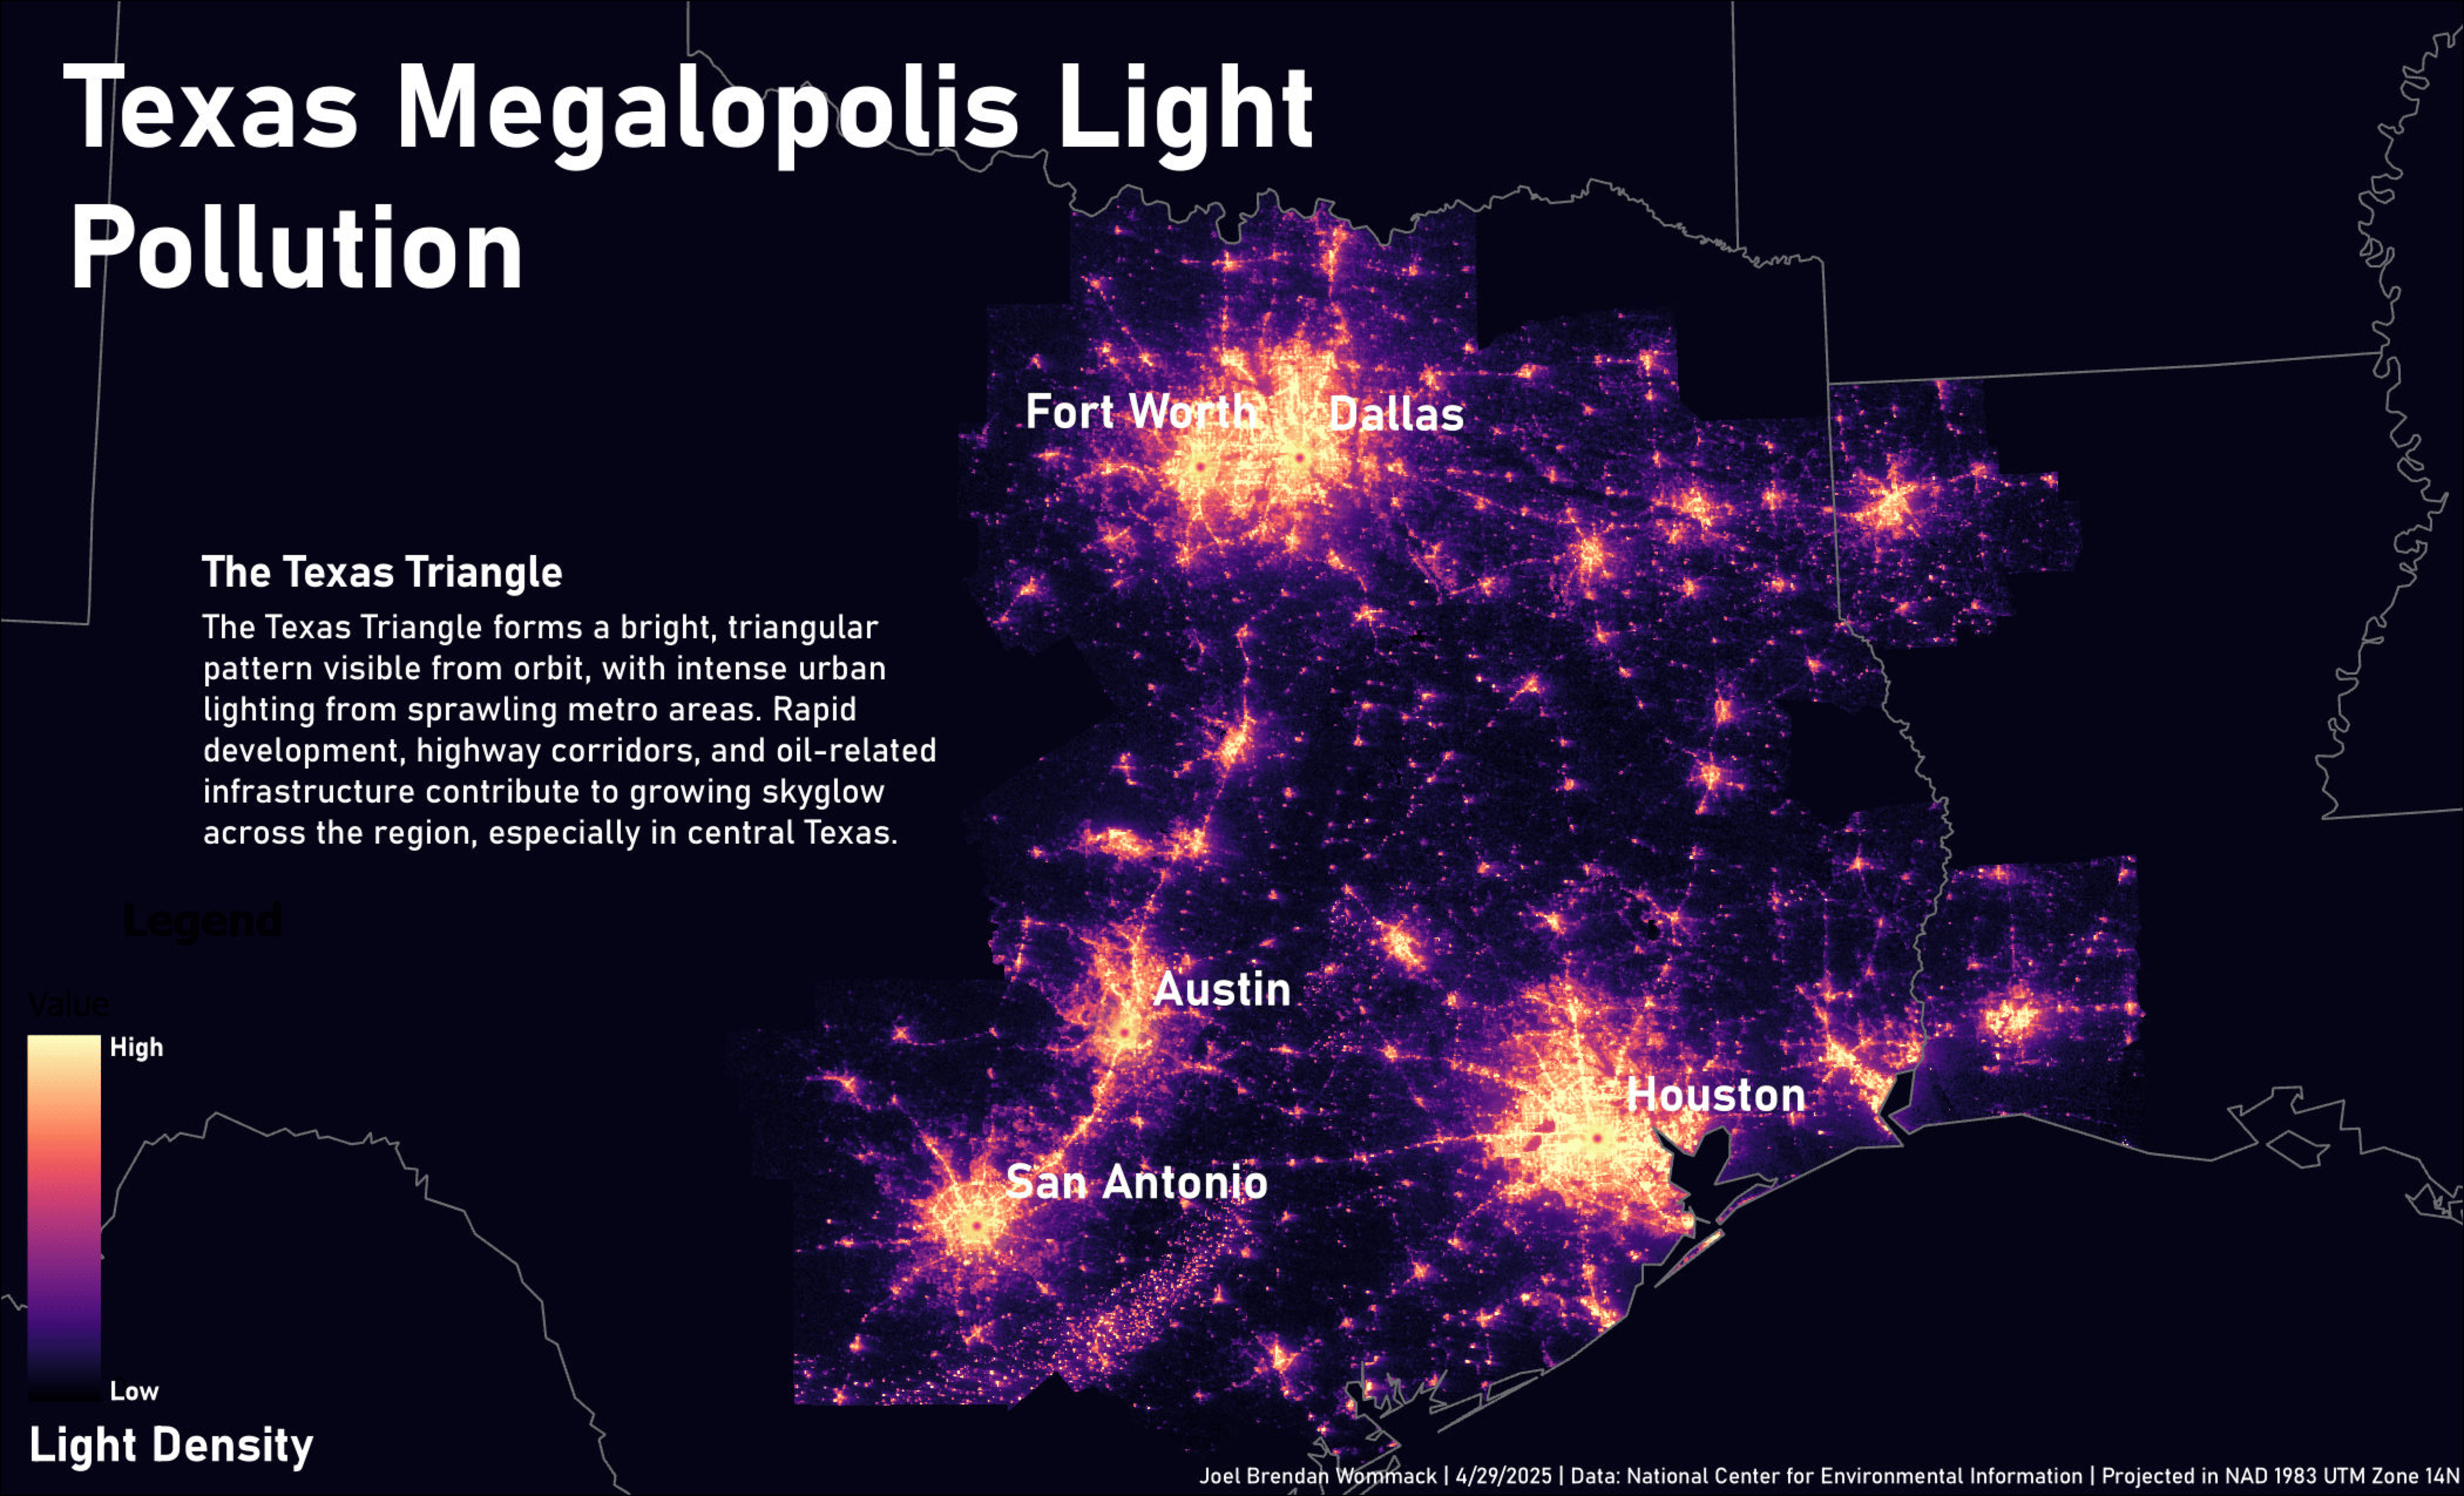
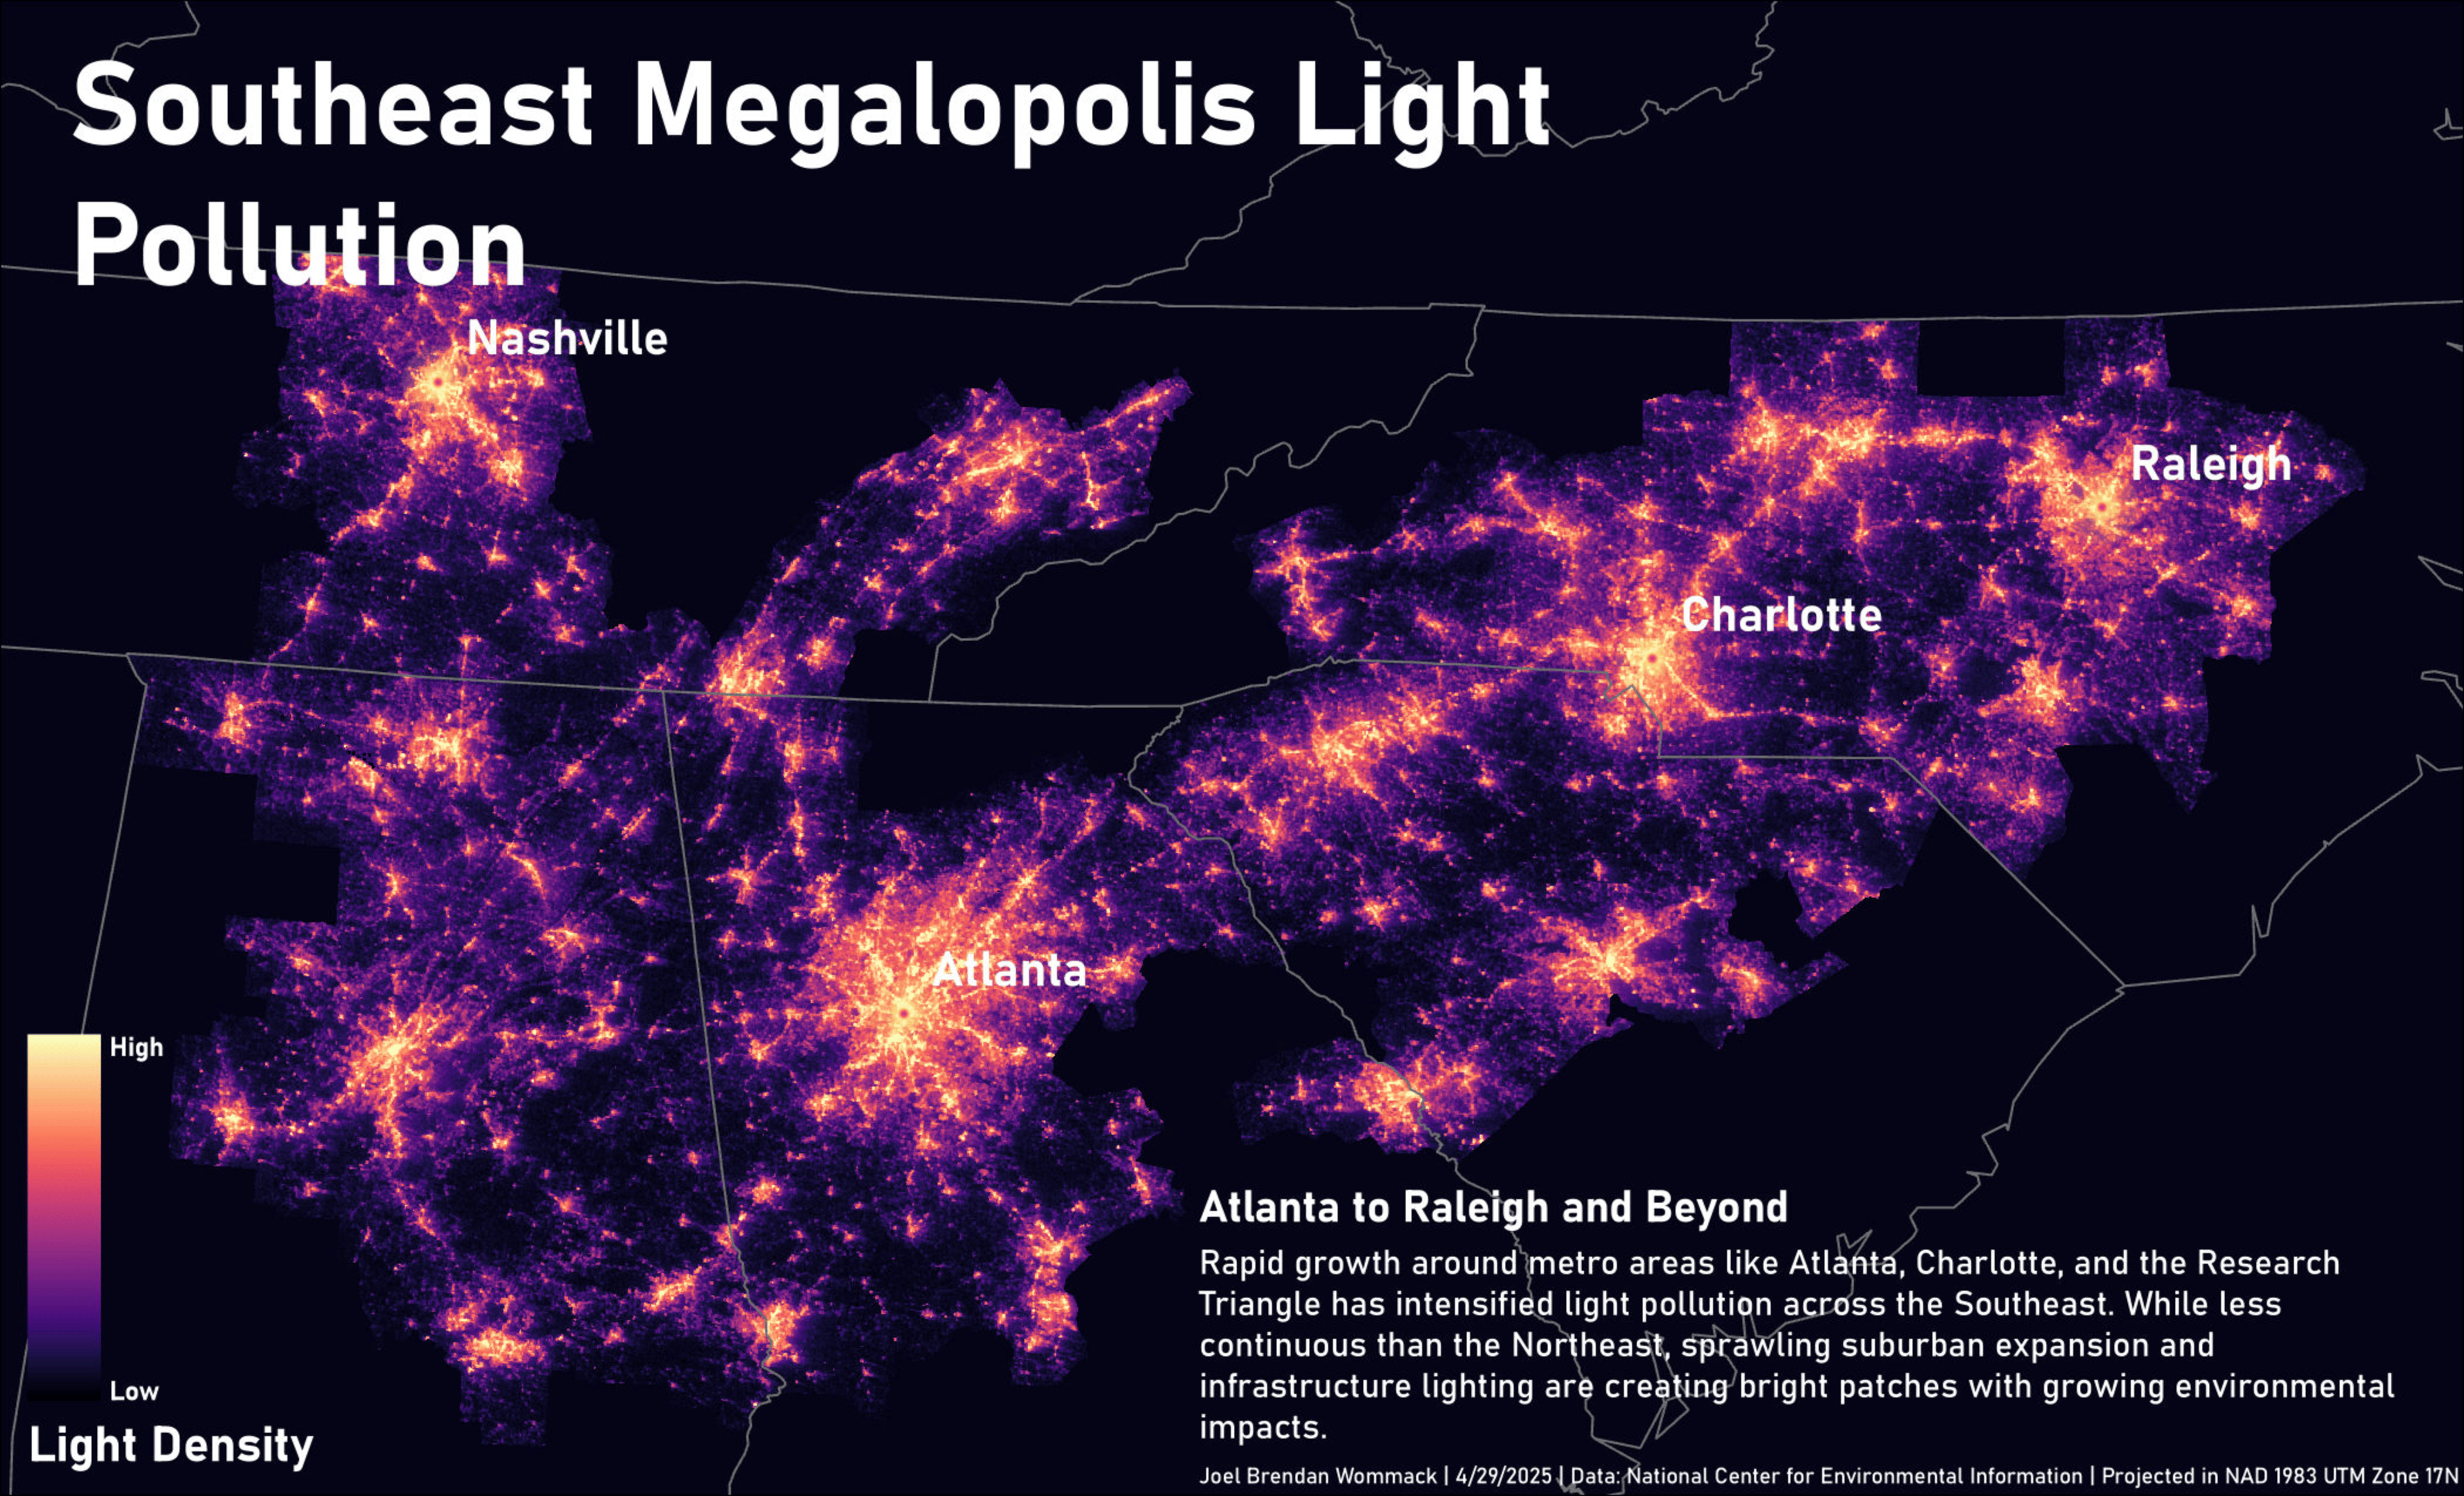
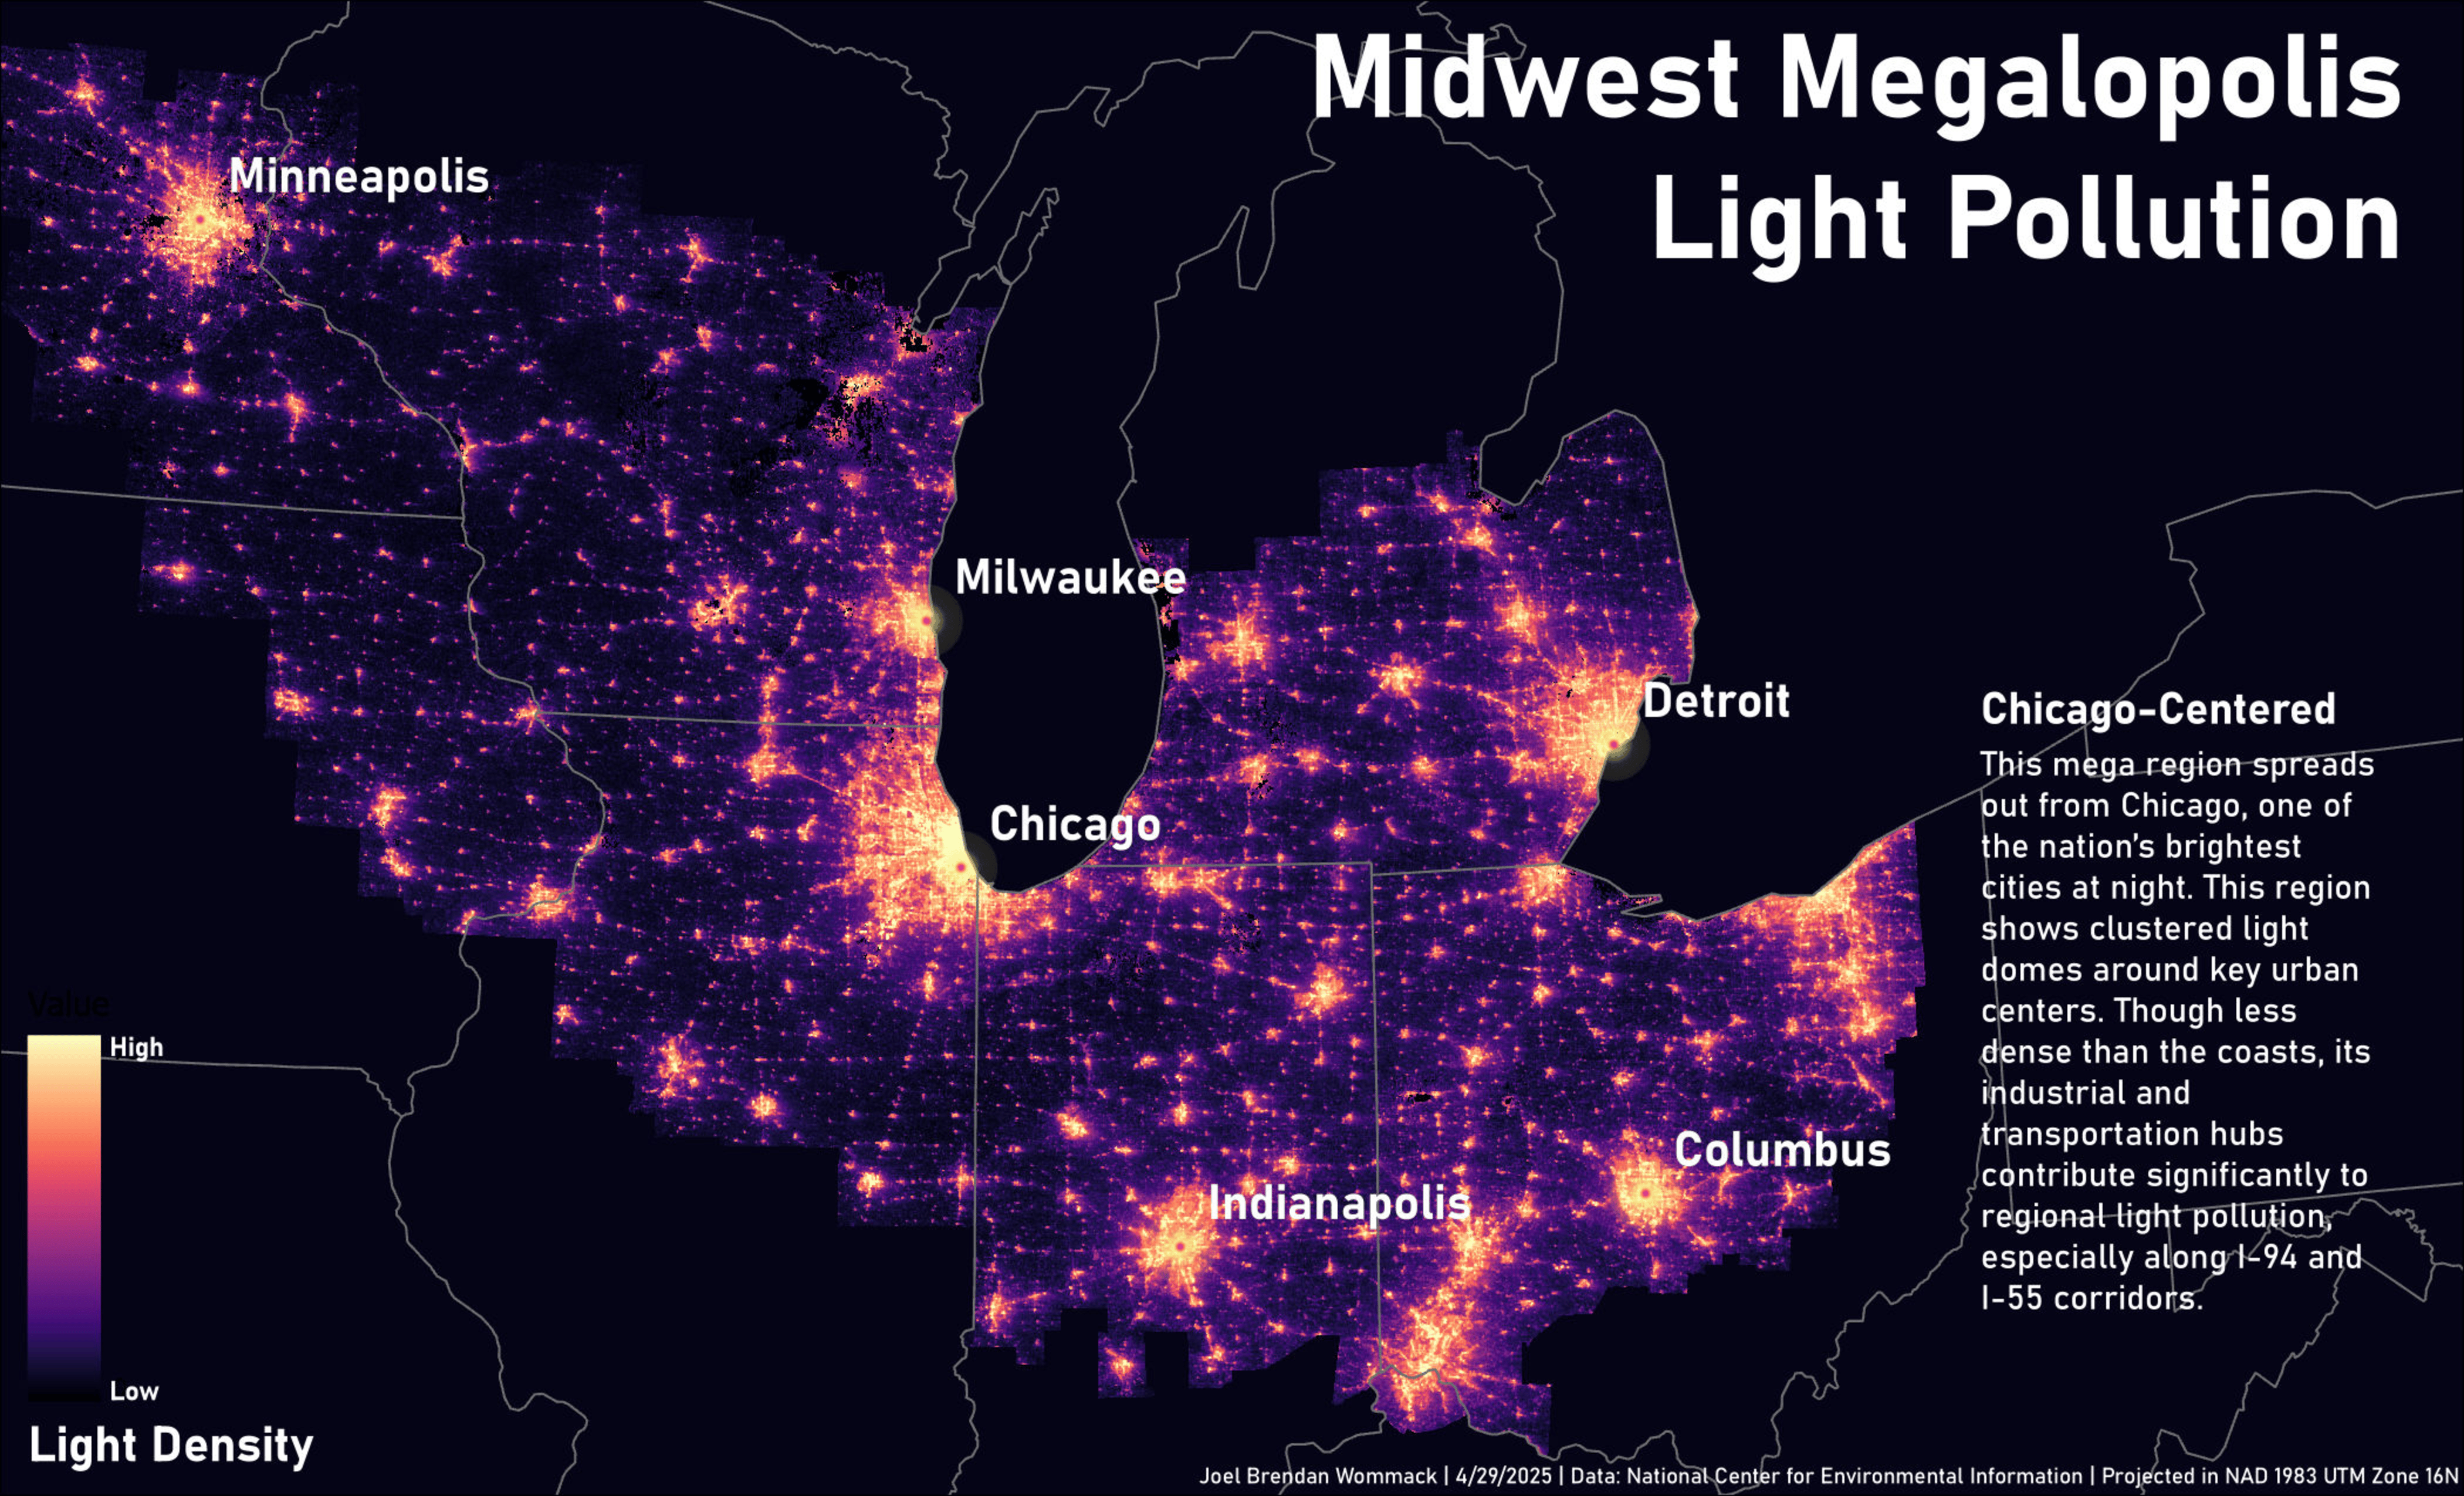
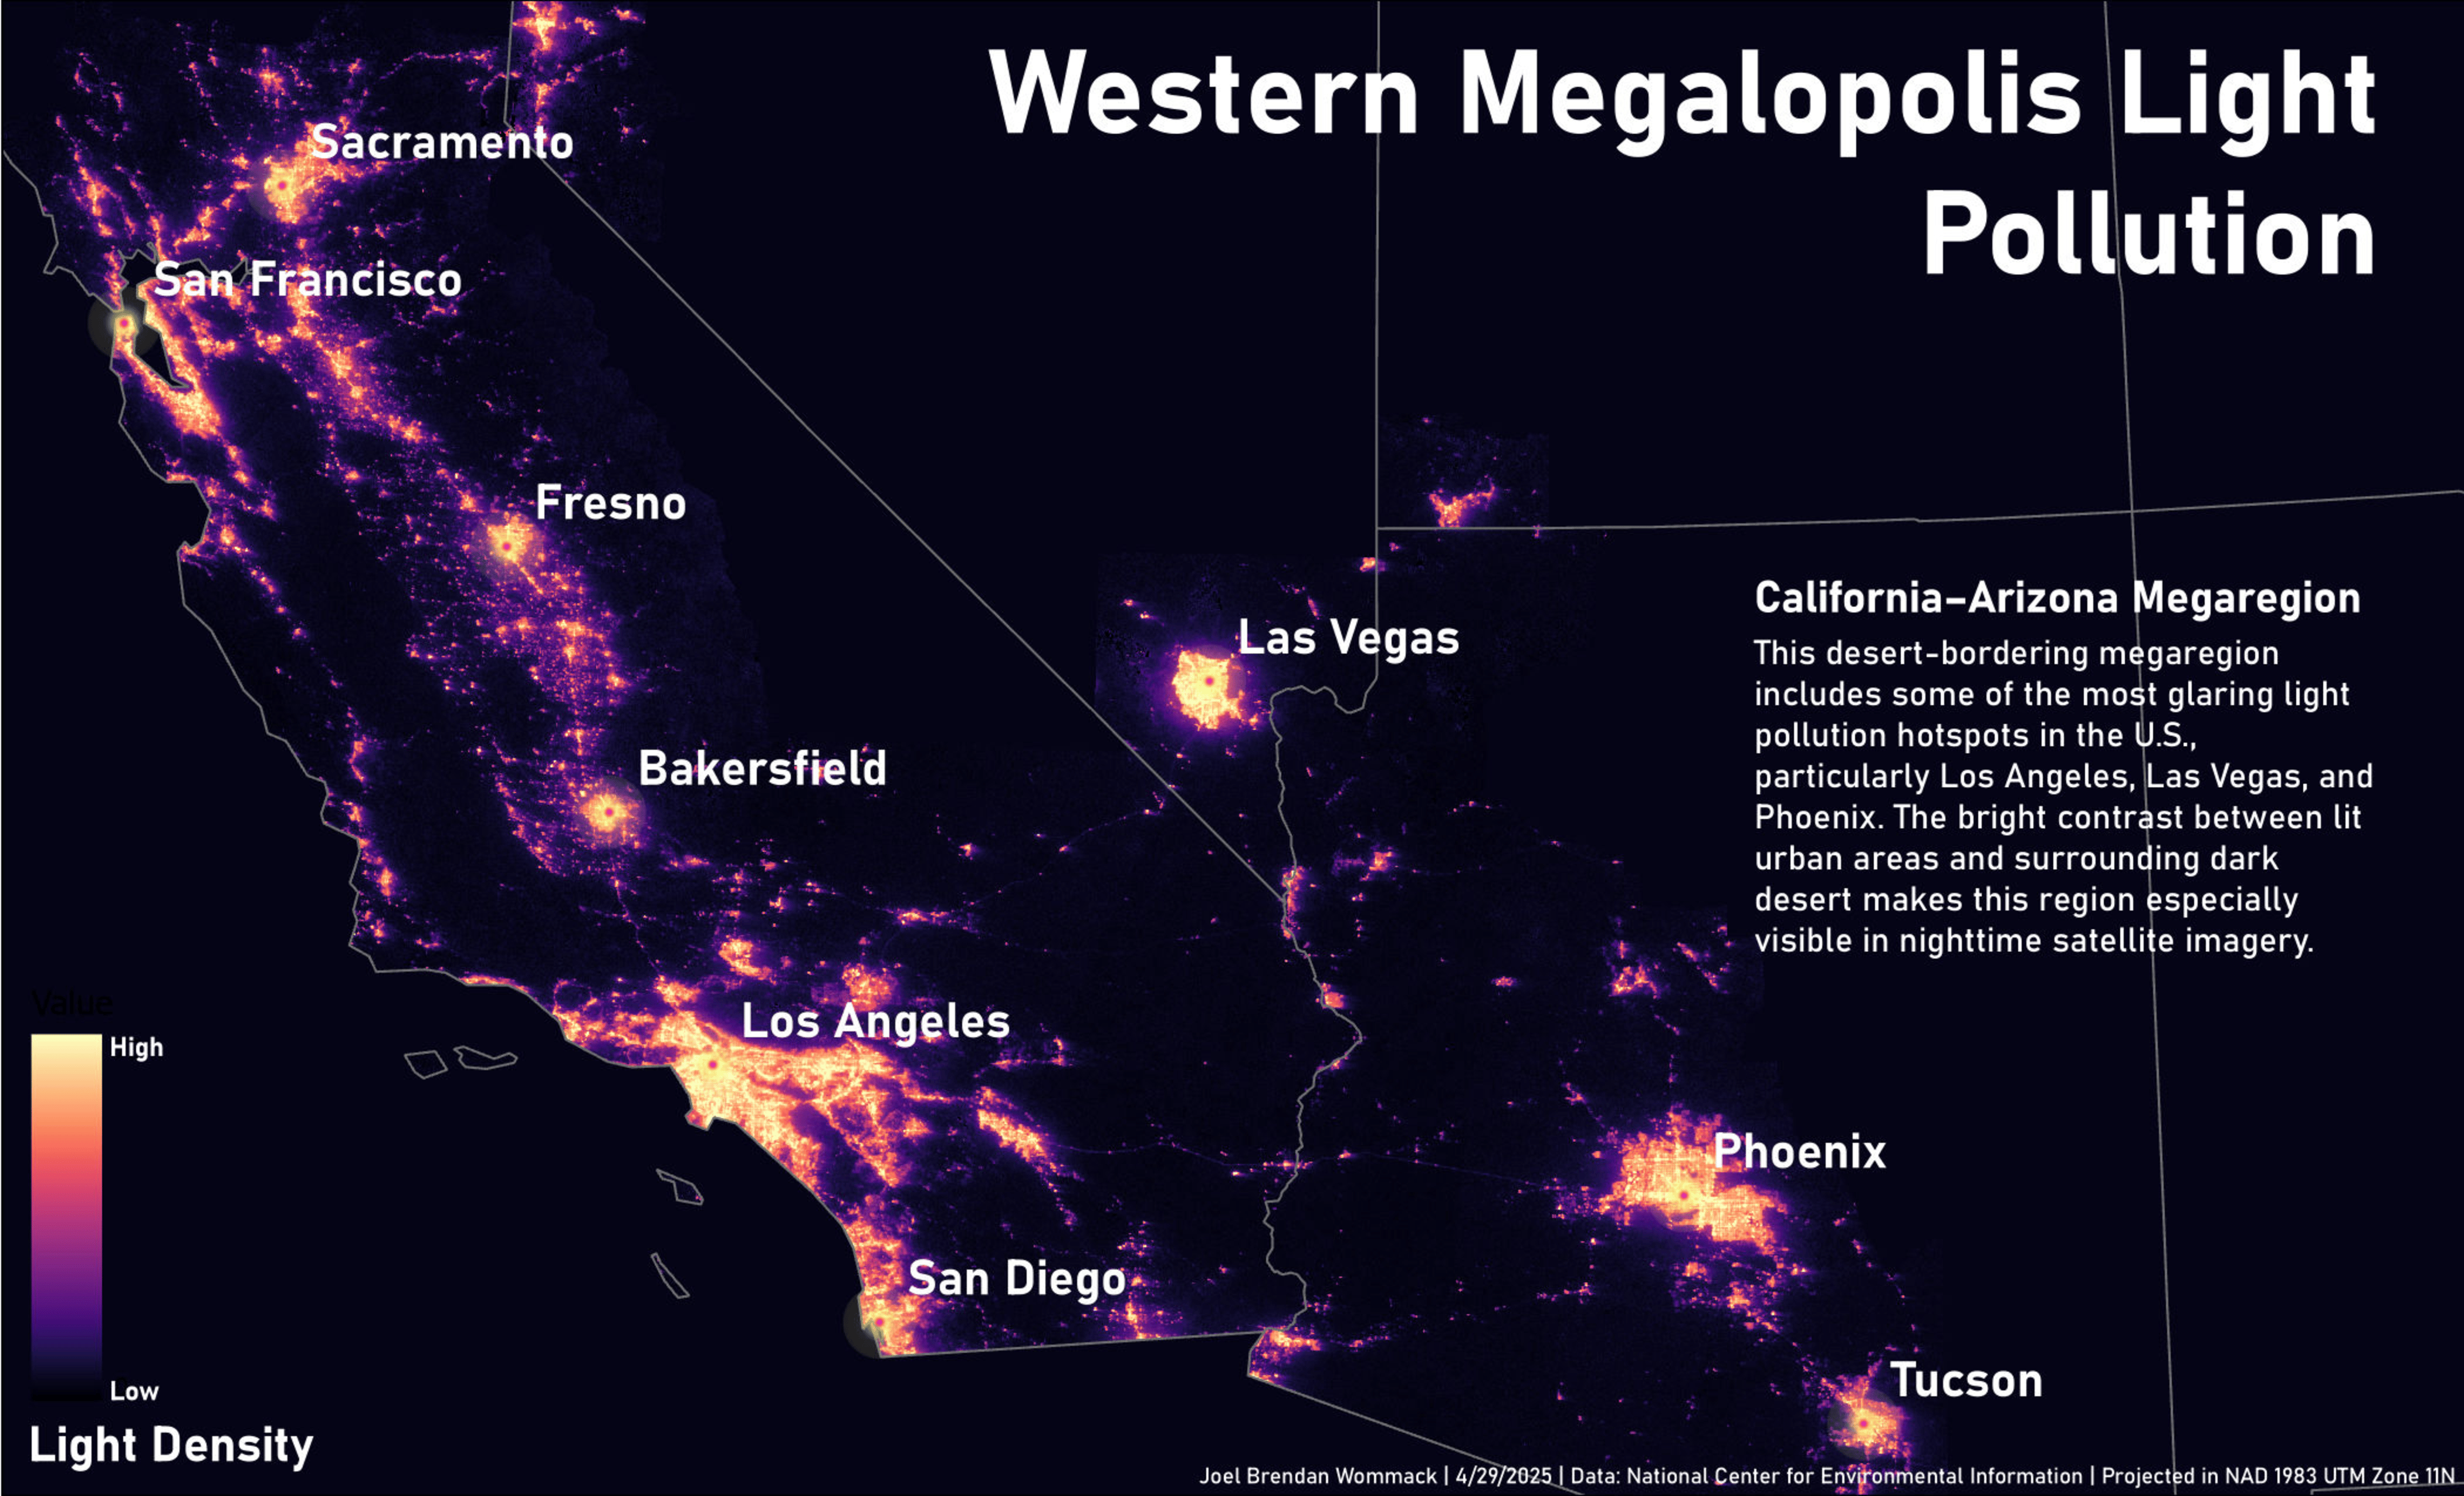
This personal project automates the creation of a multi-page map series using Python and ArcPy, tailored for thematic spatial analysis across U.S. megaregions. The workflow selects geographic areas based on custom criteria such as population density thresholds and city population cutoffs, and processes raster and vector datasets to produce consistent outputs.
The script performs the following key tasks:
• Reprojects all input data to the appropriate UTM zone for spatial accuracy.
• Selects counties within a user-defined megaregion using attribute-based queries.
• Calculates and filters counties by population density to focus on high-density areas.
• Clips a light pollution raster to the selected counties for targeted visualization.
• Applies standardized symbology to ensure visual consistency across outputs.
• Identifies and clips major cities (e.g., population > 400,000) to highlight urban centers within the high-density region.
The resulting maps were used to produce a thematic series focused on light pollution patterns across five U.S. megaregions. By encapsulating complex geoprocessing steps into a repeatable script, the project streamlines the creation of a data-rich map series.
Python Script
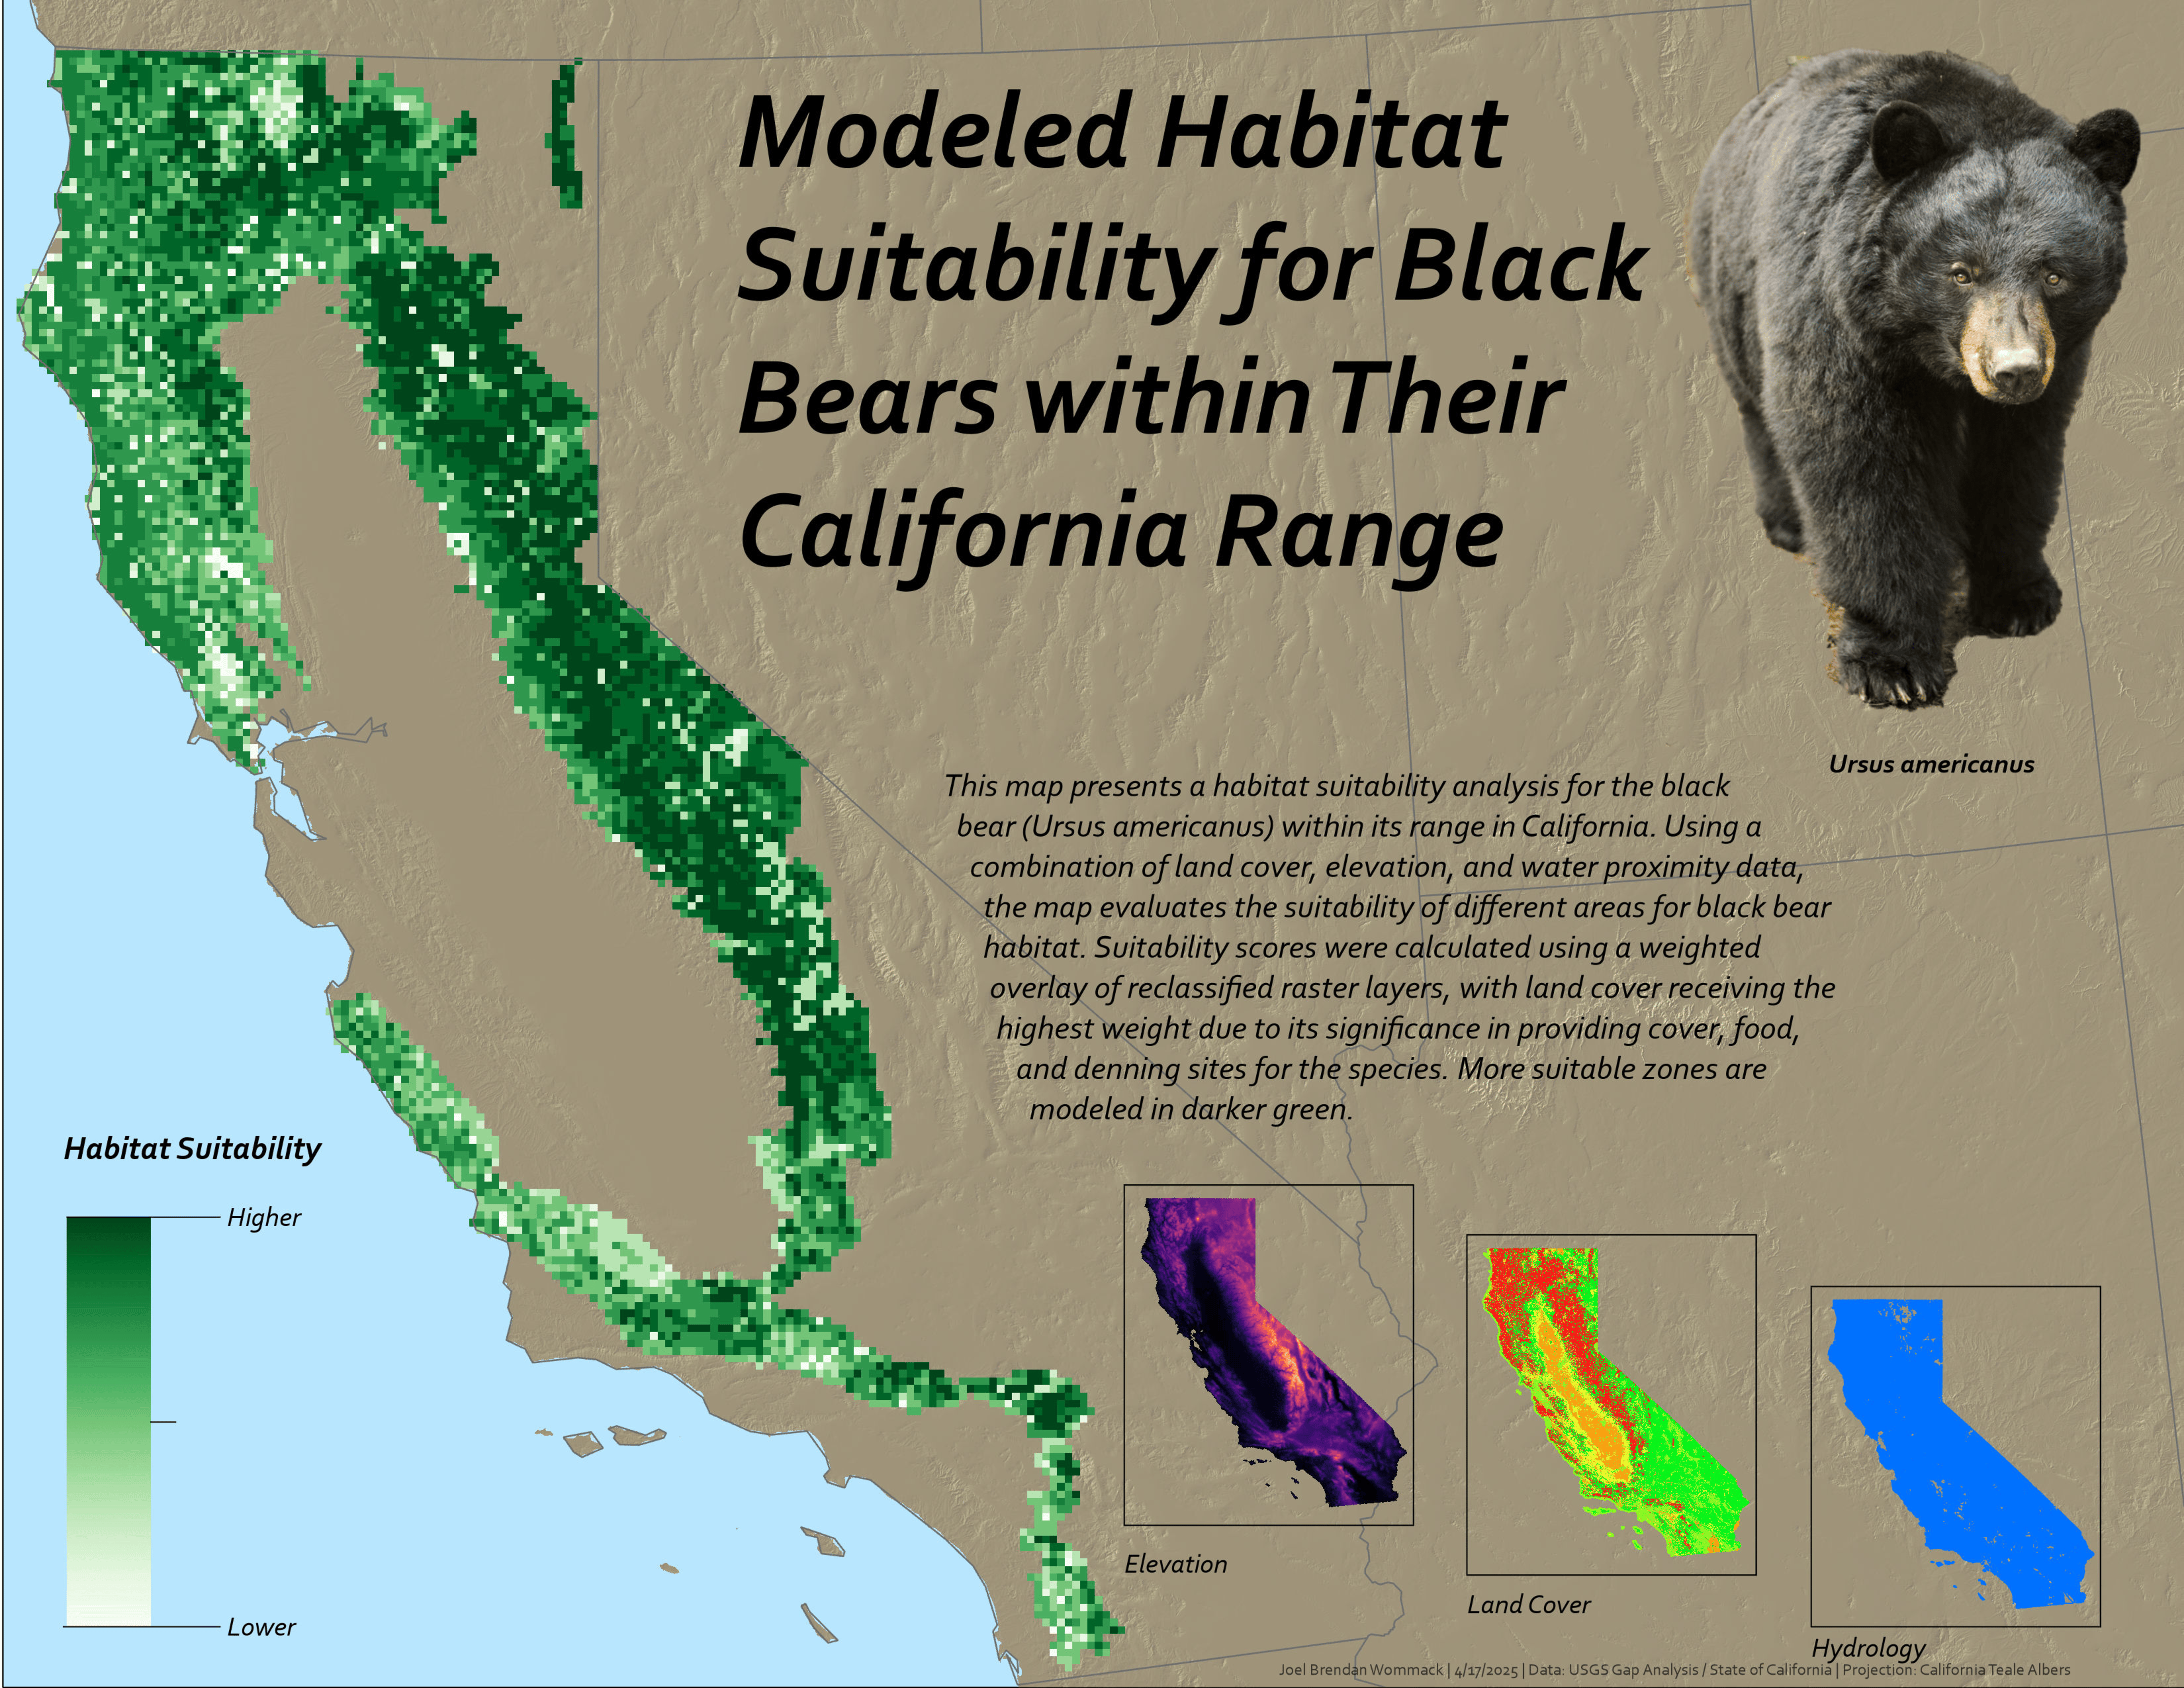
>Habitat Suitability Analysis
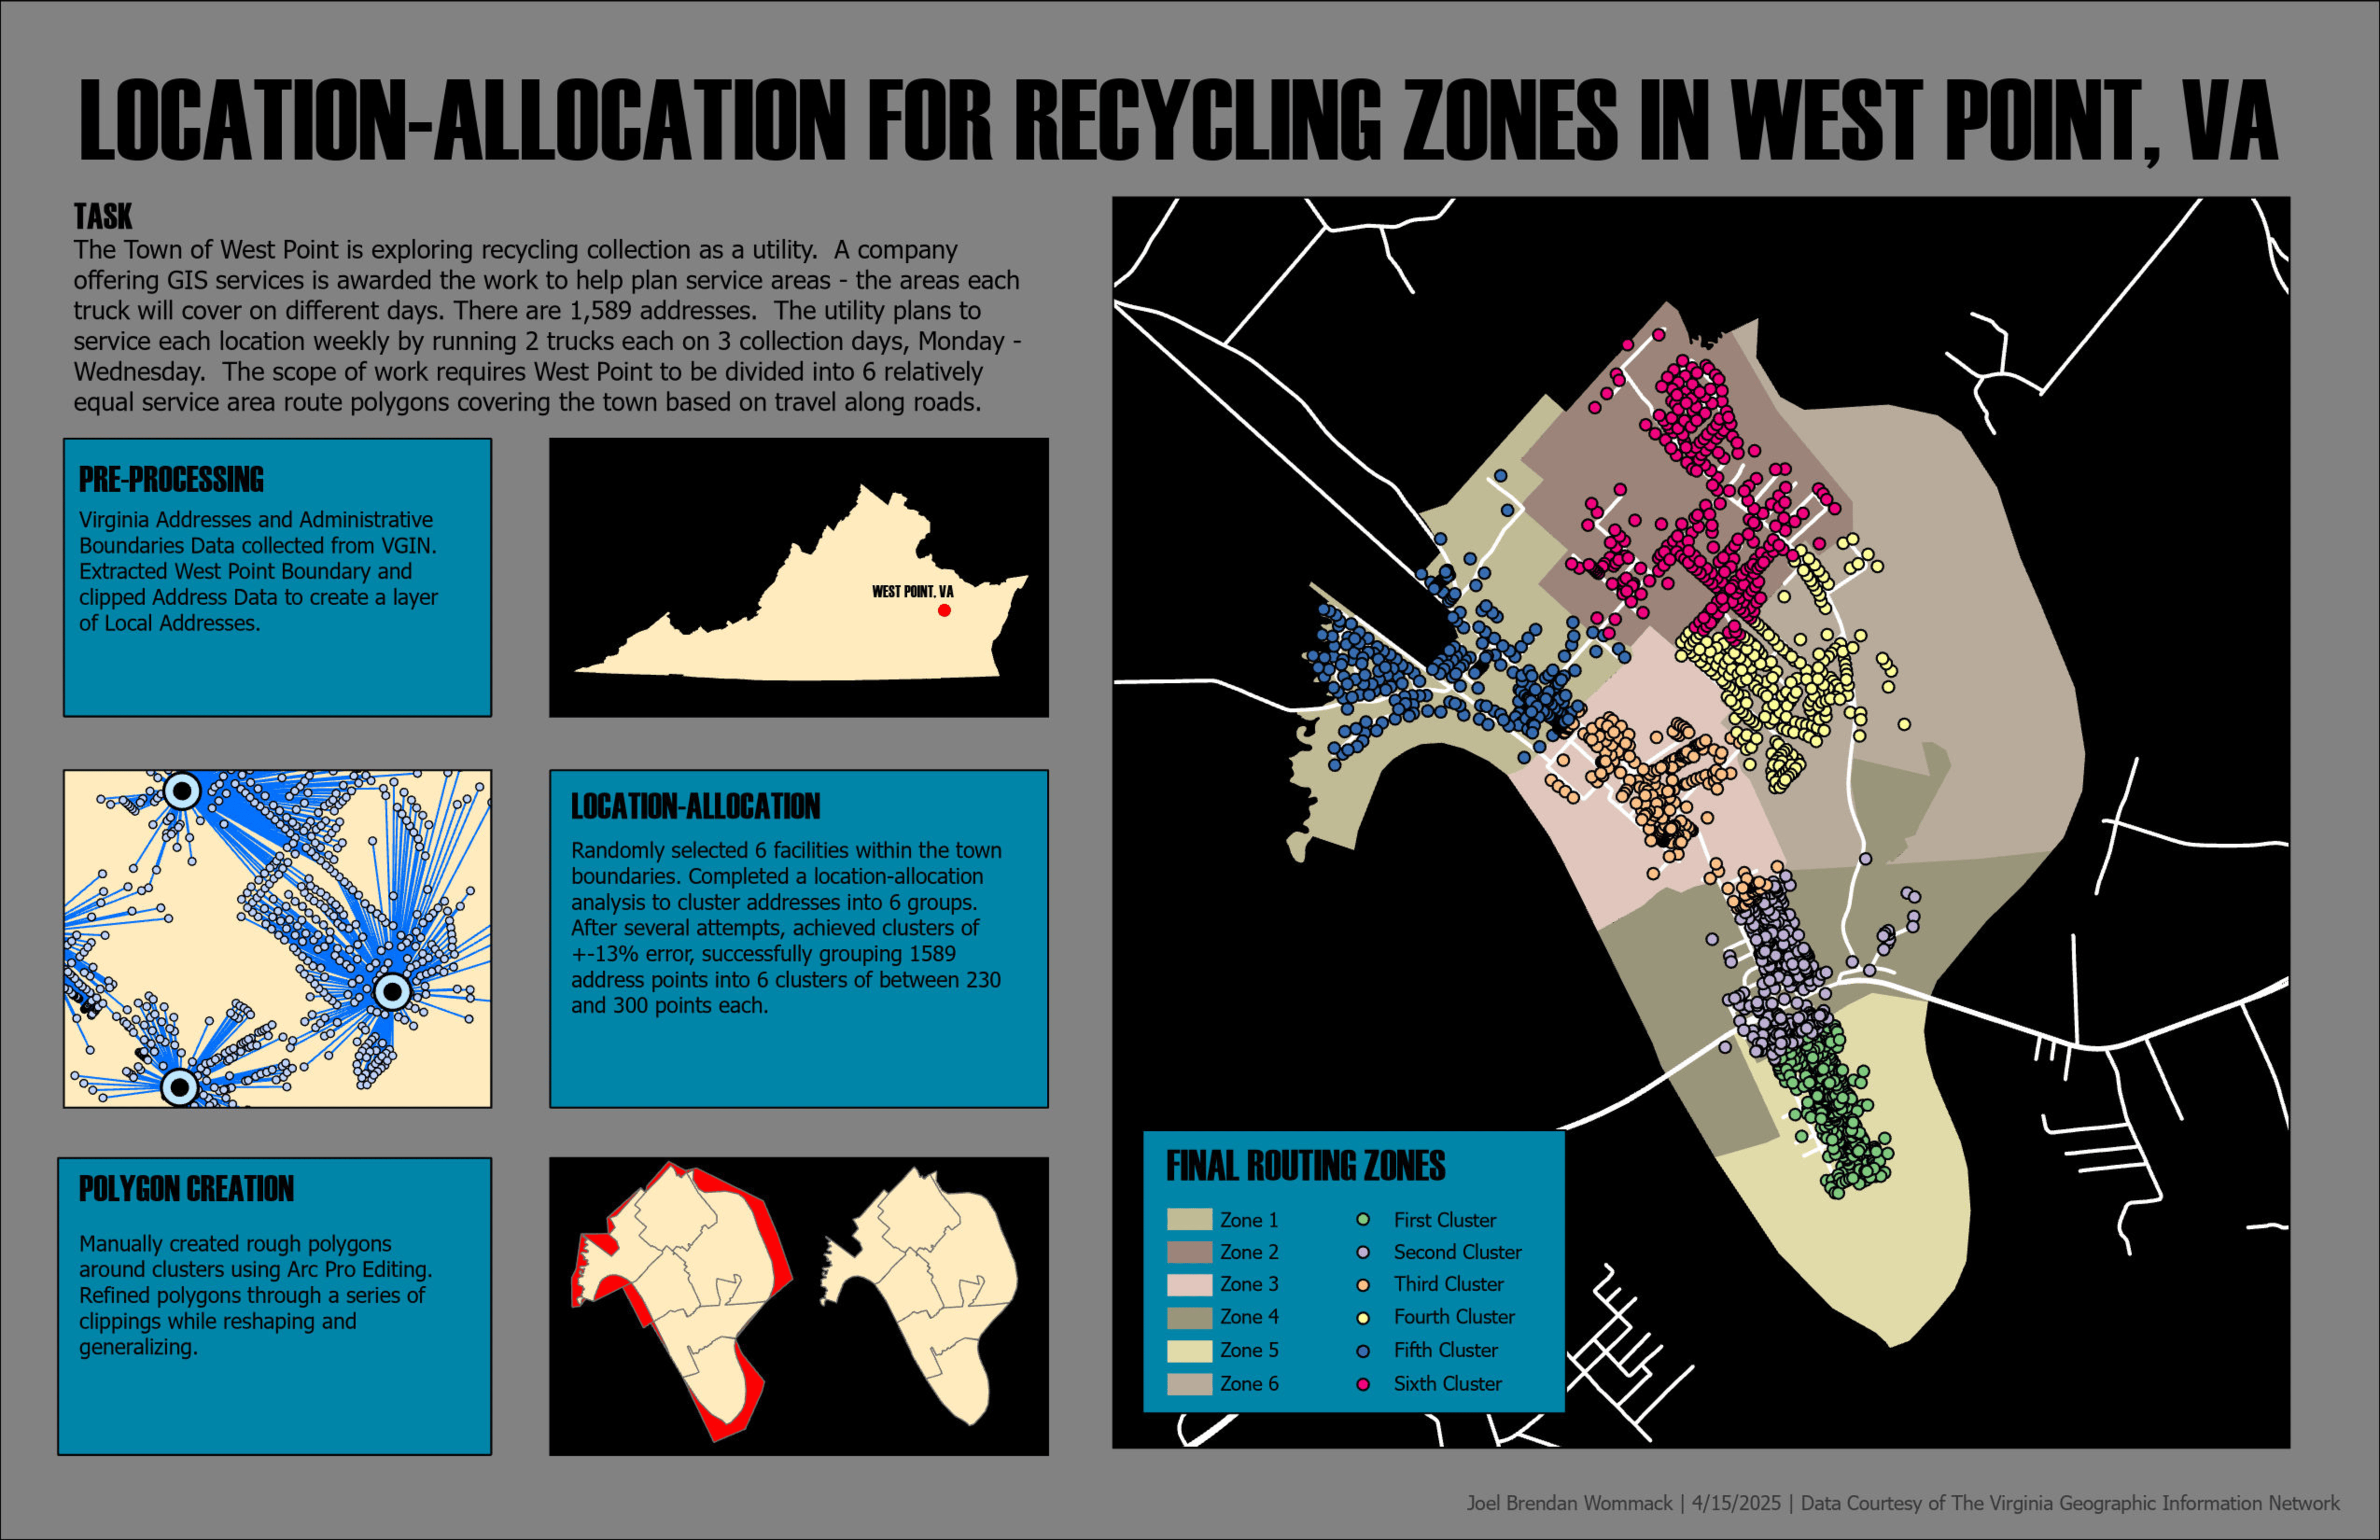
Service Area Analysis
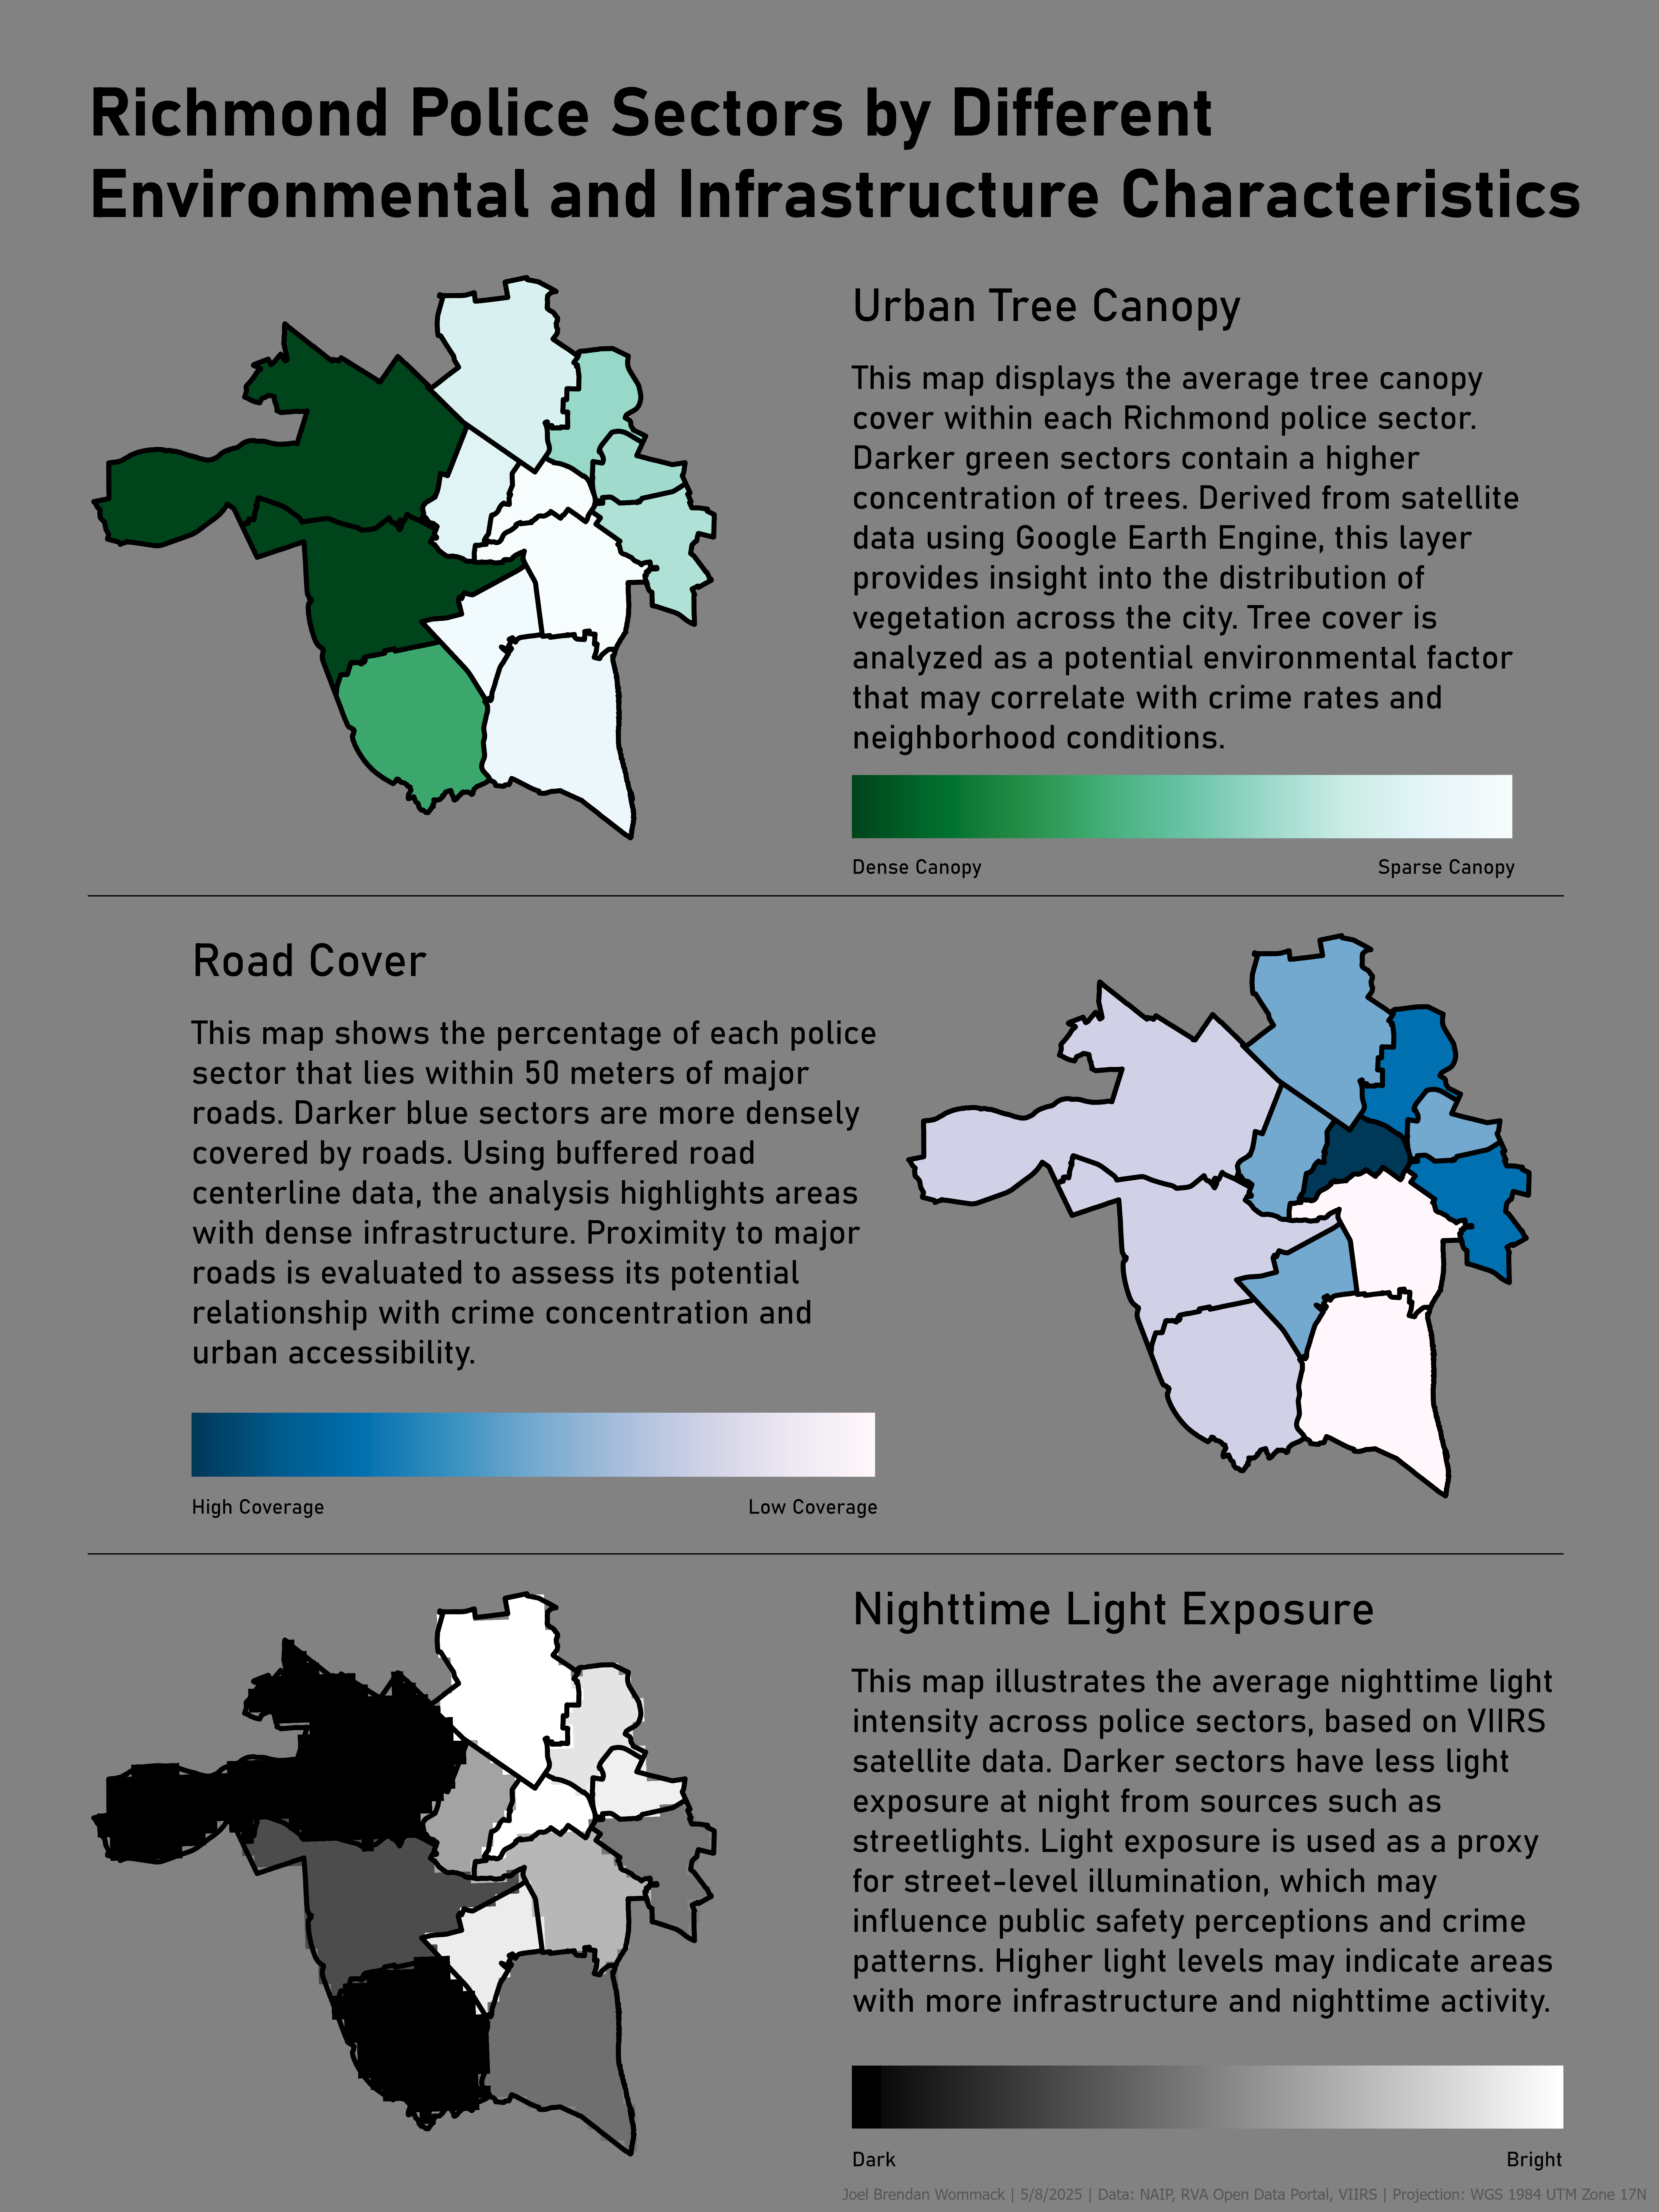
Environmental Risk Factors & Crime Patterns — Richmond, VA
This project investigates spatial relationships between environmental infrastructure characteristics and crime patterns across Richmond, Virginia police sectors. Environmental variables include urban tree canopy (extracted using Google Earth Engine), road proximity coverage, and nighttime light exposure derived from satellite data. These variables were analyzed alongside aggregated crime categories to explore potential correlations between urban form and public safety outcomes.
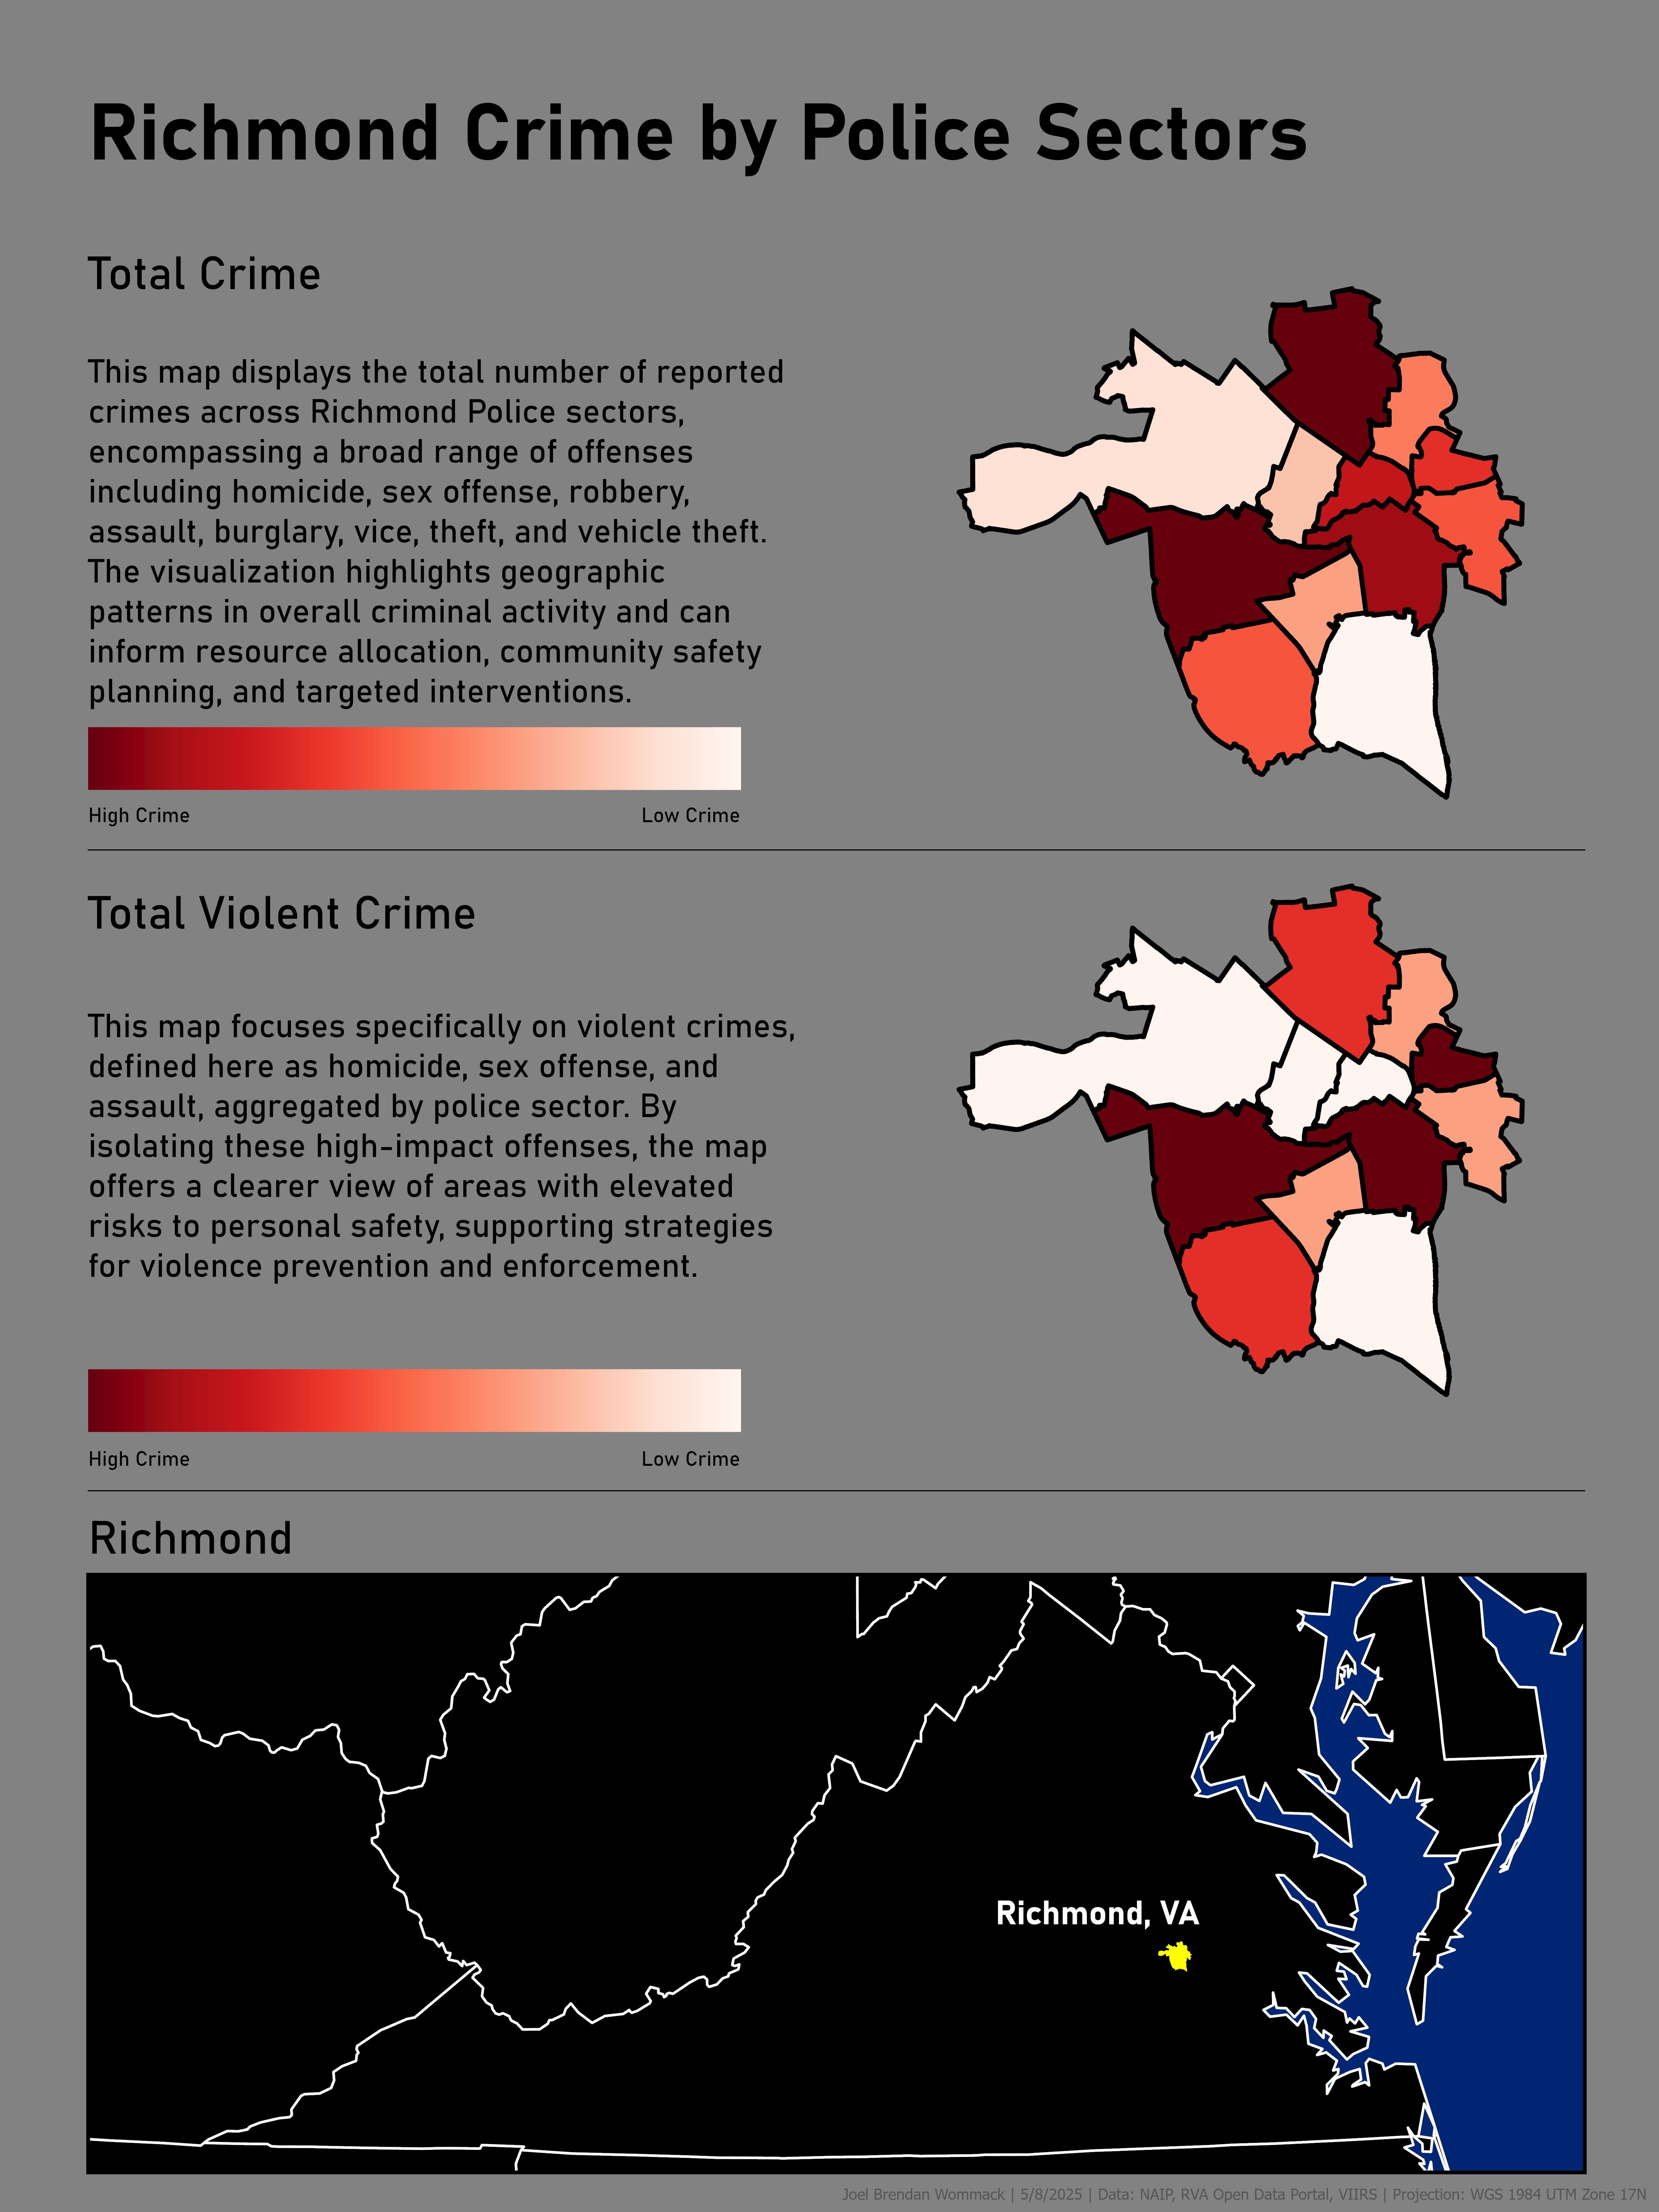
A Python-based workflow was developed to calculate pairwise correlations between environmental risk indicators and crime categories. Results were visualized through a correlation heatmap, highlighting statistically meaningful associations such as relationships between reduced tree canopy, limited lighting exposure, and specific offense types. This integrated GIS and data science approach demonstrates how remote sensing, spatial analysis, and statistical modeling can be combined to evaluate urban environmental influences on crime patterns.
Cartographic & Spatial Analysis Gallery
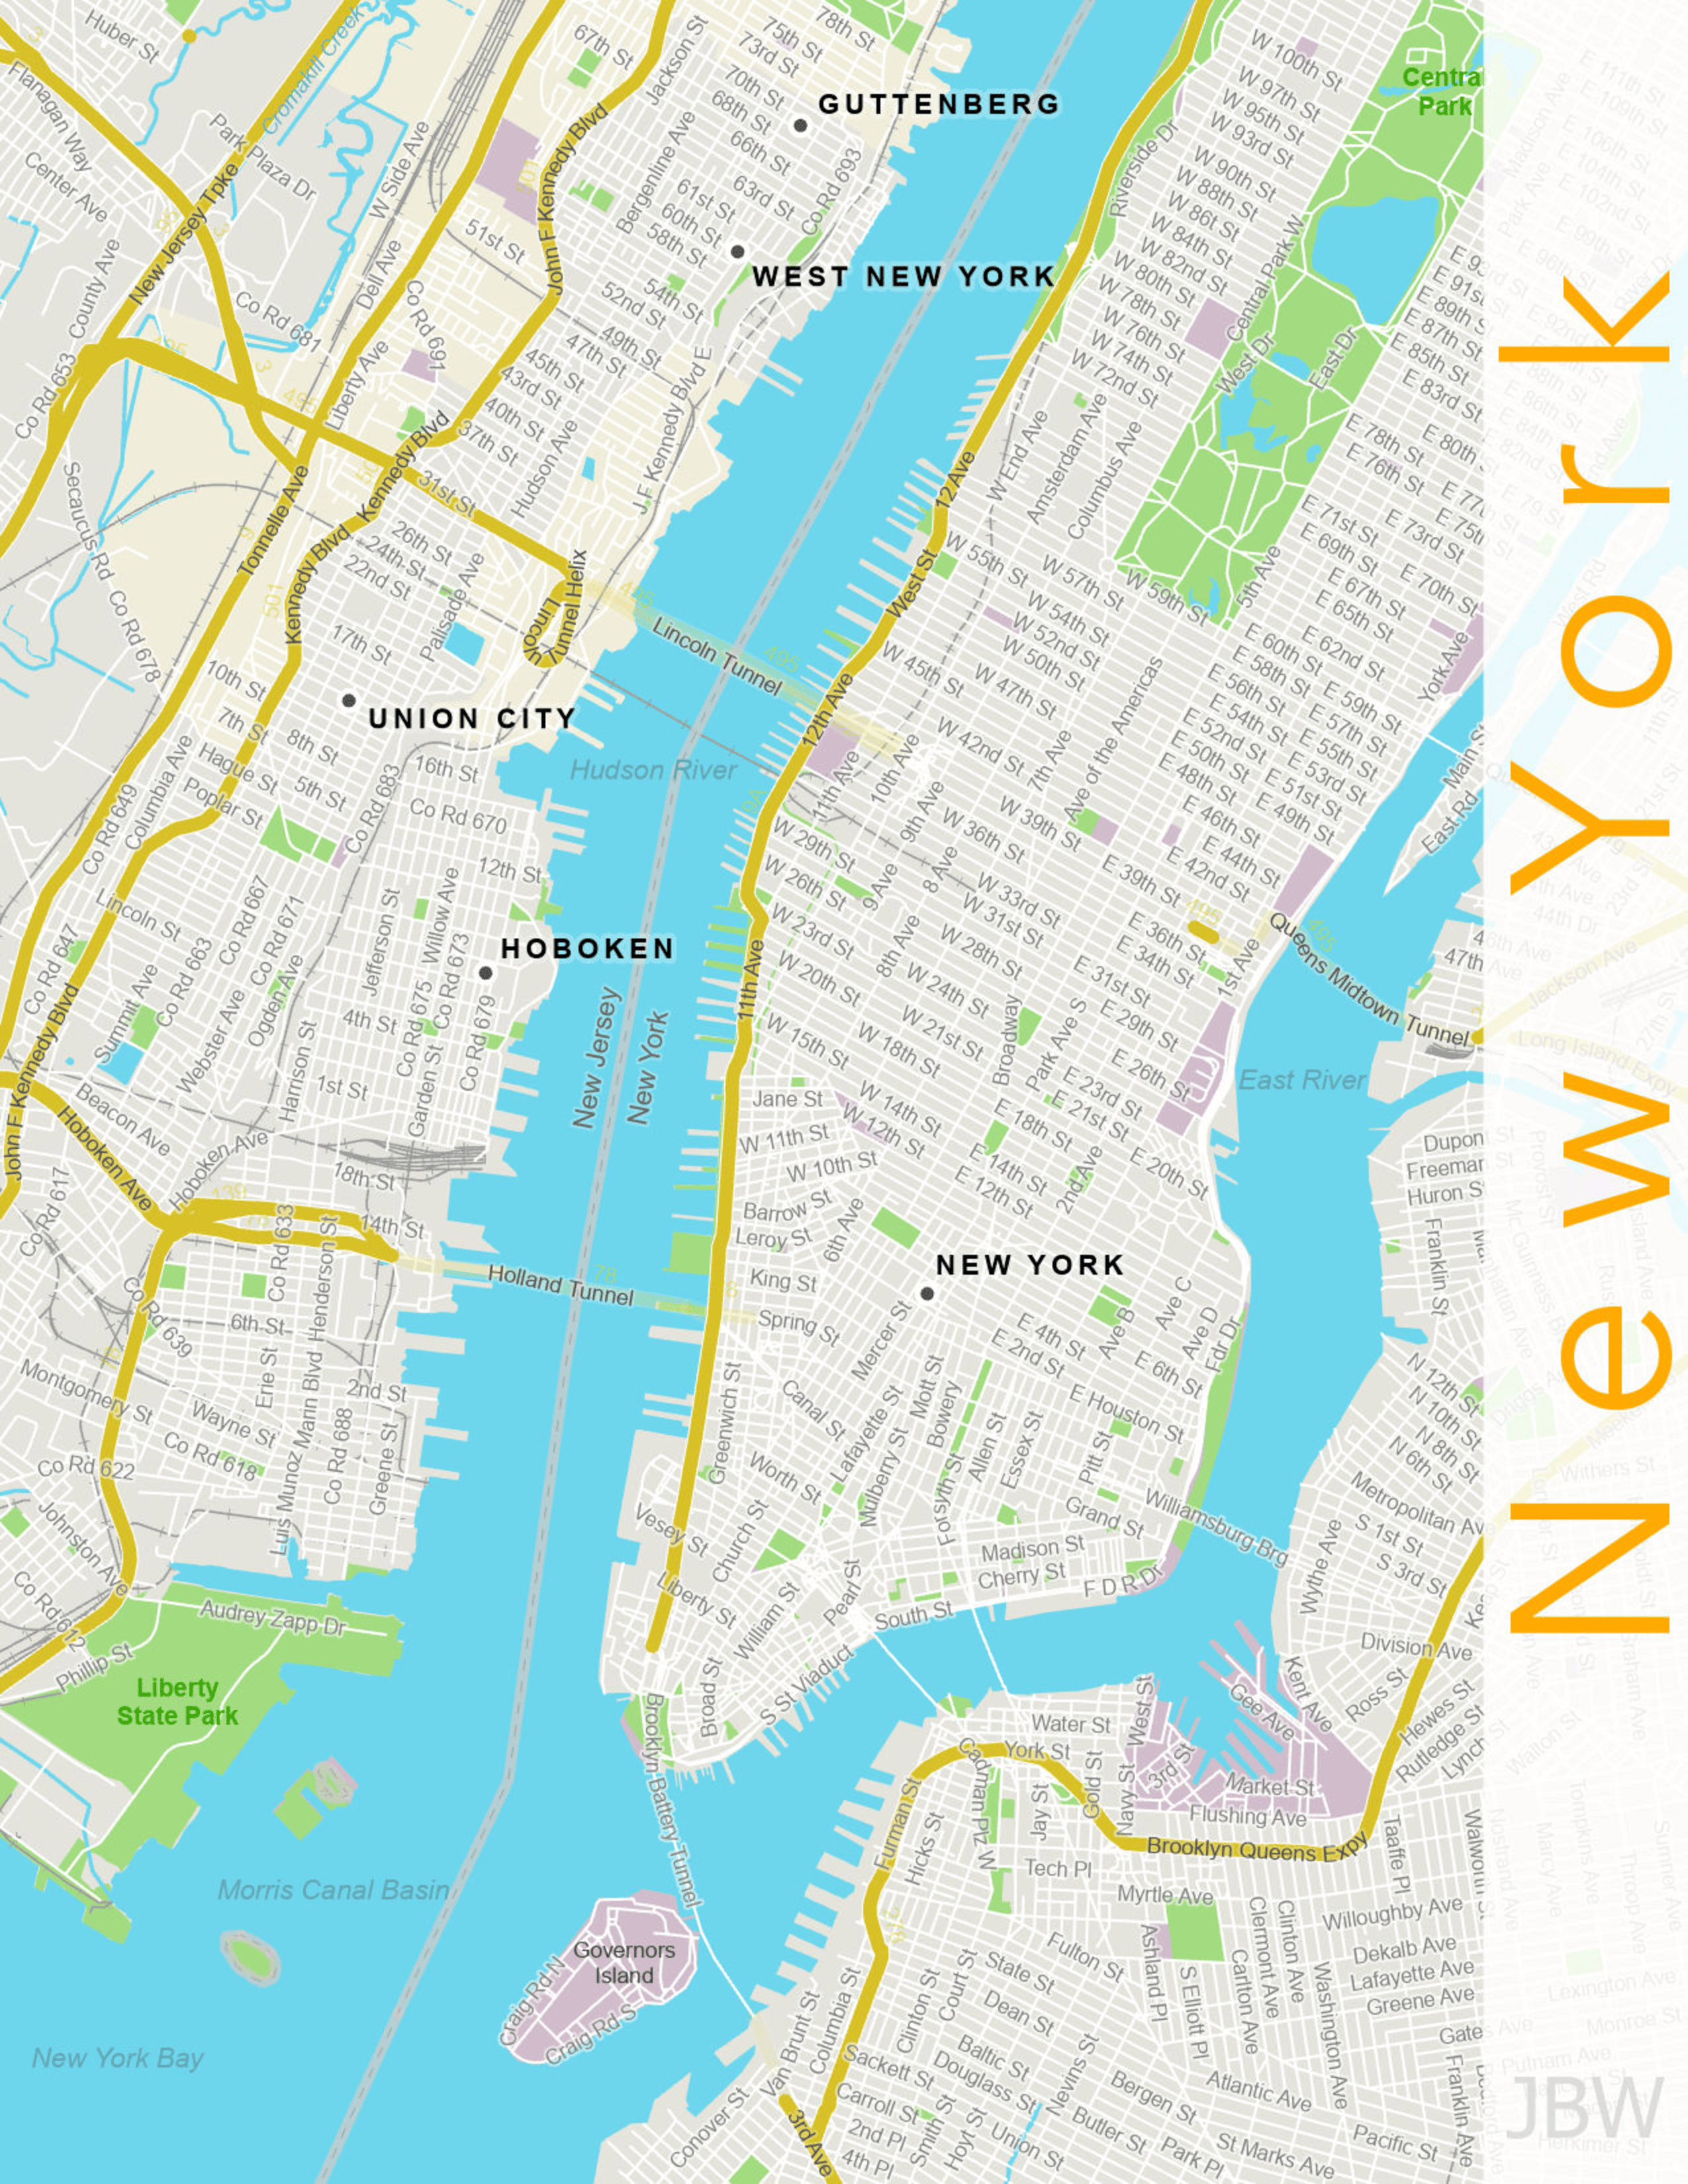
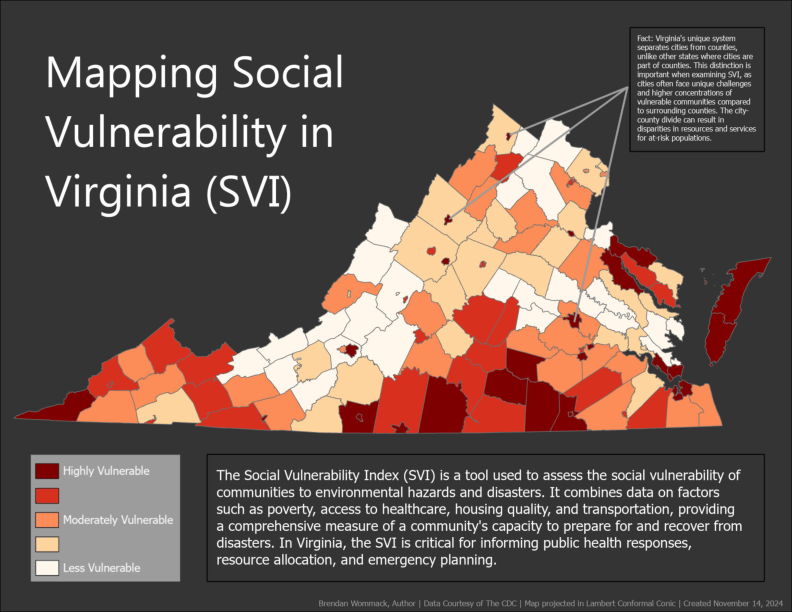
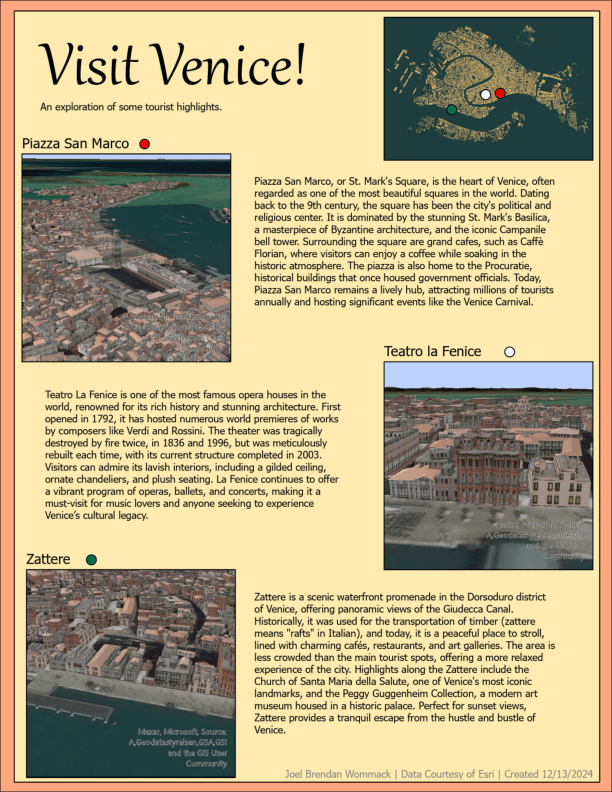
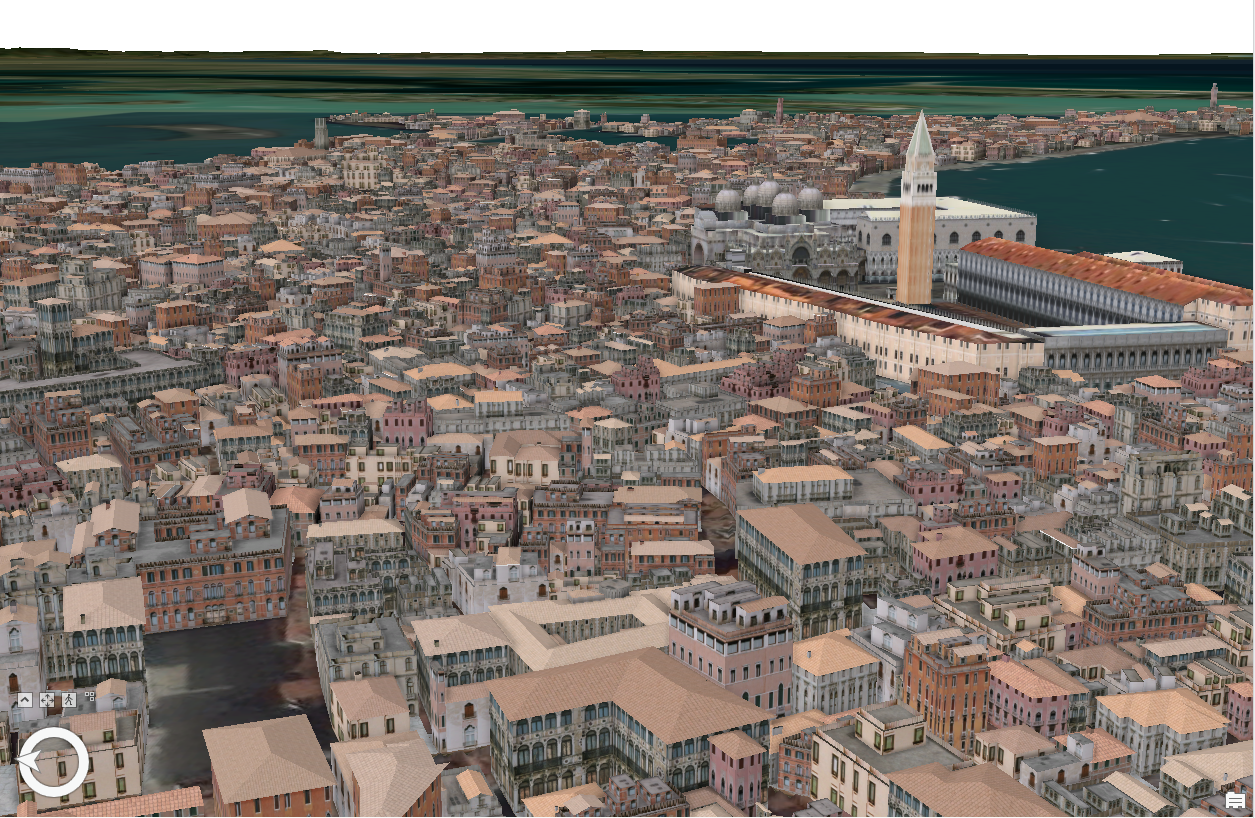
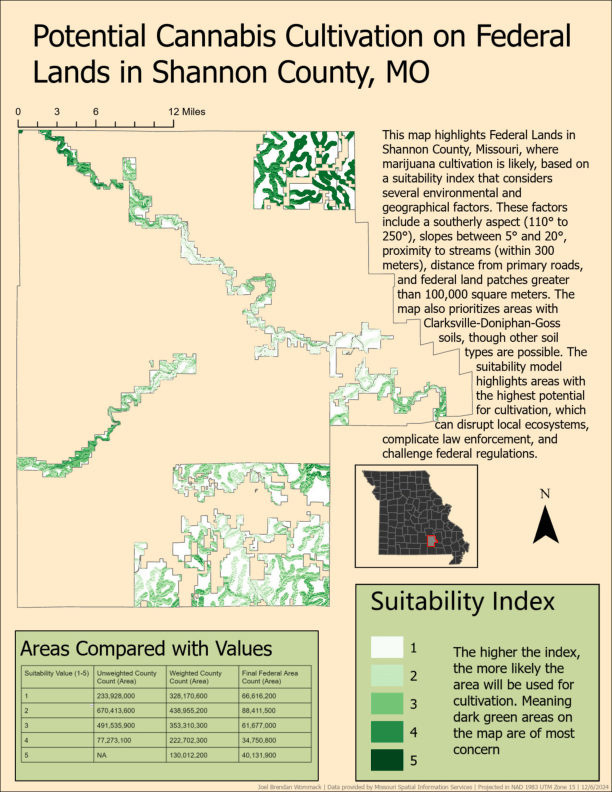
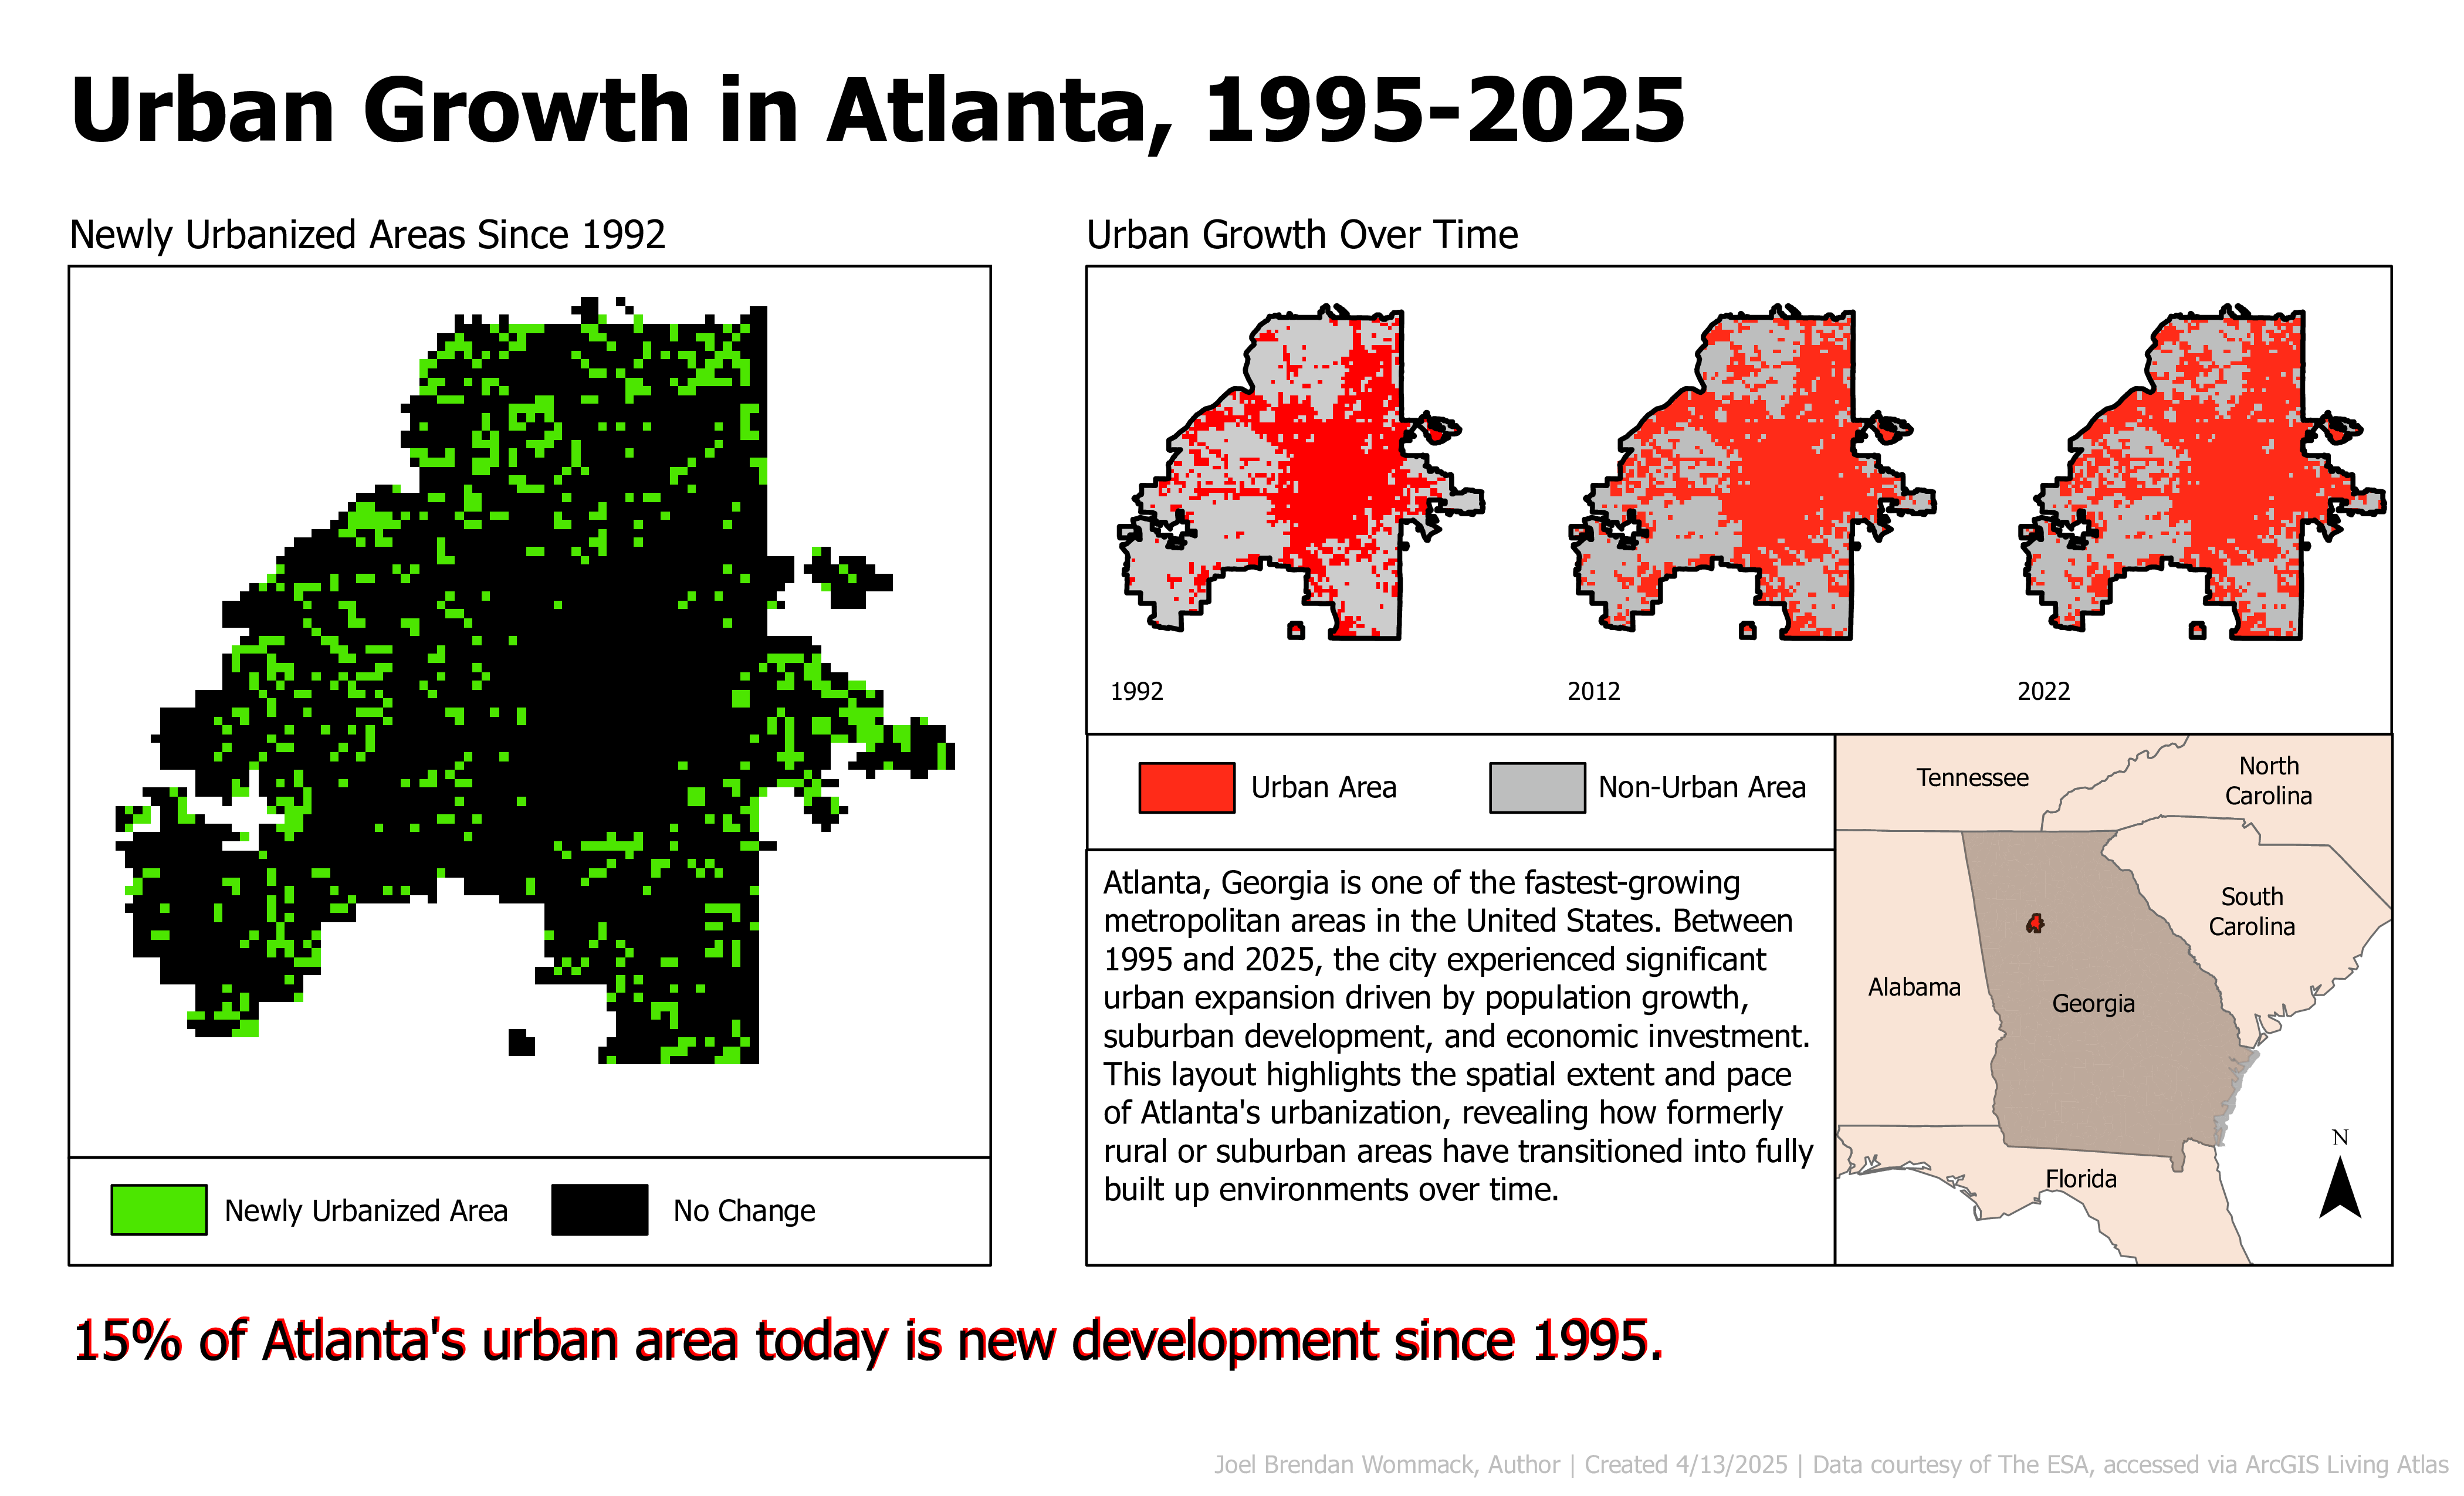
This gallery showcases selected cartographic and spatial analysis projects, including georeferencing, suitability modeling, 3D visualization, thematic mapping, and symbology refinement. Together, these works demonstrate technical proficiency in GIS workflows and an emphasis on clear, publication-quality map design.